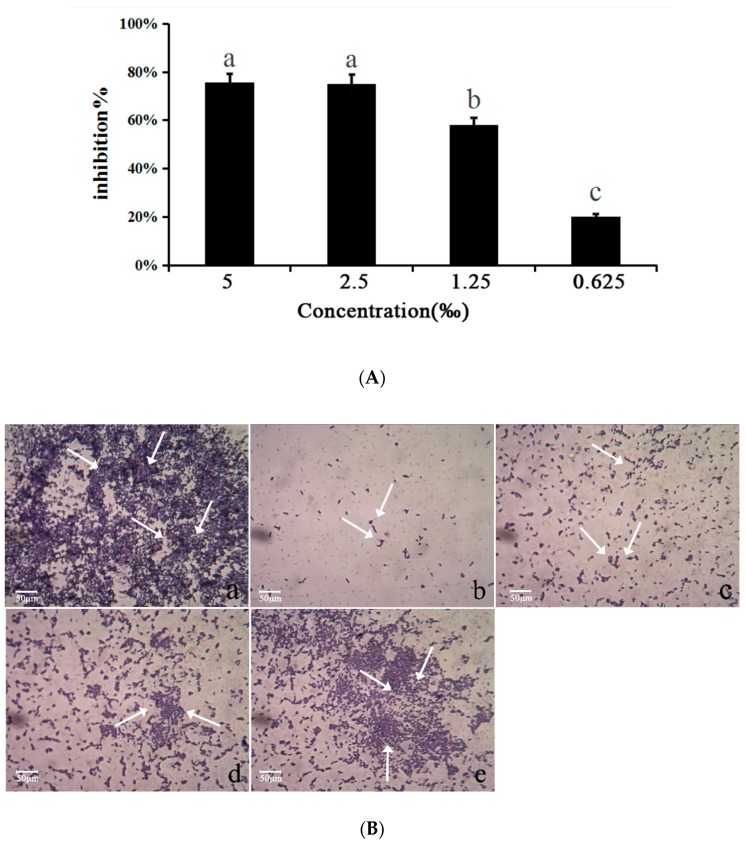
Figure 5.
M. bracteata EO reduced biofilm formation of C. violaceum. (A) Quantitative assessment of biofilm biomass inhibition. Mean values of eight independent experiments and SD are shown. Bars indicate standard errors and different letters (a–c) above the bars represent significant differences (p < 0.05). (B) Light microscope images (a–e) under a light microscope at a magnification of 40×. a: untreated; b: 5‰; c: 2.5‰; d: 1.25‰; e: 0.625‰. The arrows indicate the dyed biofilm.

