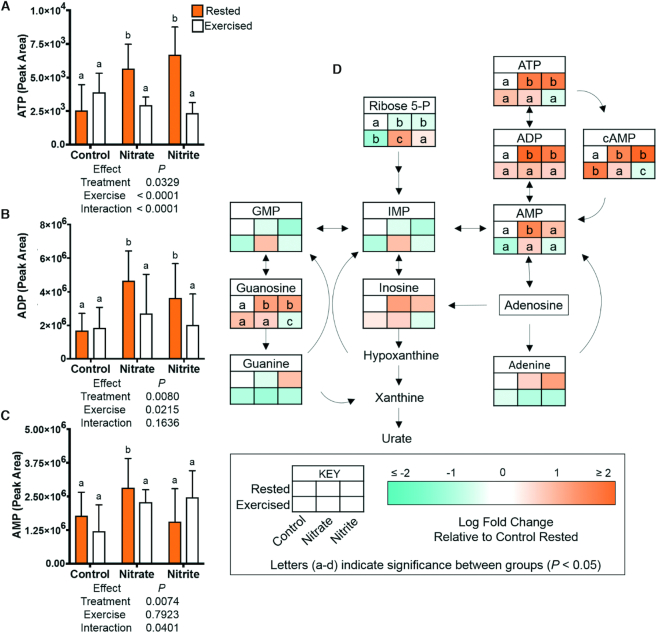
FIGURE 5.
Relative concentrations of metabolites involved in purine metabolism and nucleotide synthesis, including ATP and ADP, after 21–23 d of control, nitrate, or nitrite treatment and under rested or exercised conditions. Metabolites were measured by LC-MS/MS. Data are (A–C) graphs of mean metabolite values ± SD or (D) metabolic pathway. (A–D) Labeled means without a common letter differ, P < 0.05, n = 9 fish.

