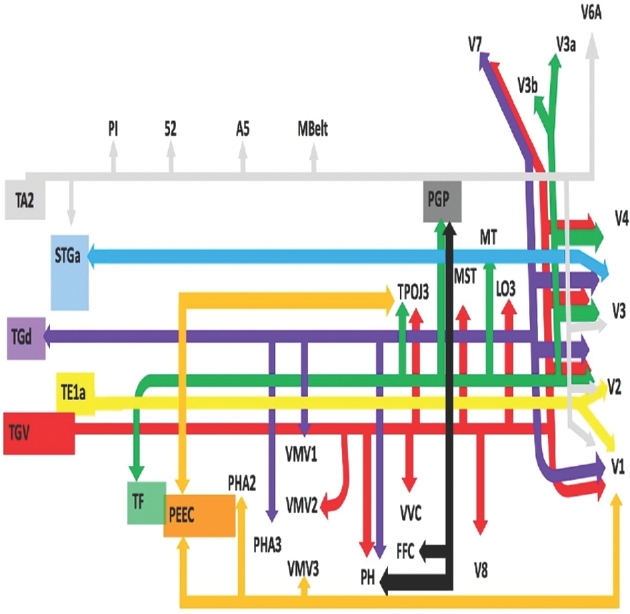
FIGURE 1.

Simplified tract map showing the structural connections that integrate within the ILF. Connections between cortical areas are color-coded based on the parcellation of origin (eg purple arrows indicate structural connections from origin TGd to areas V1, V2, V3, V7, PH, PHA3, and VMV1). Note that arrows are not meant to imply the direction of information transmit.
