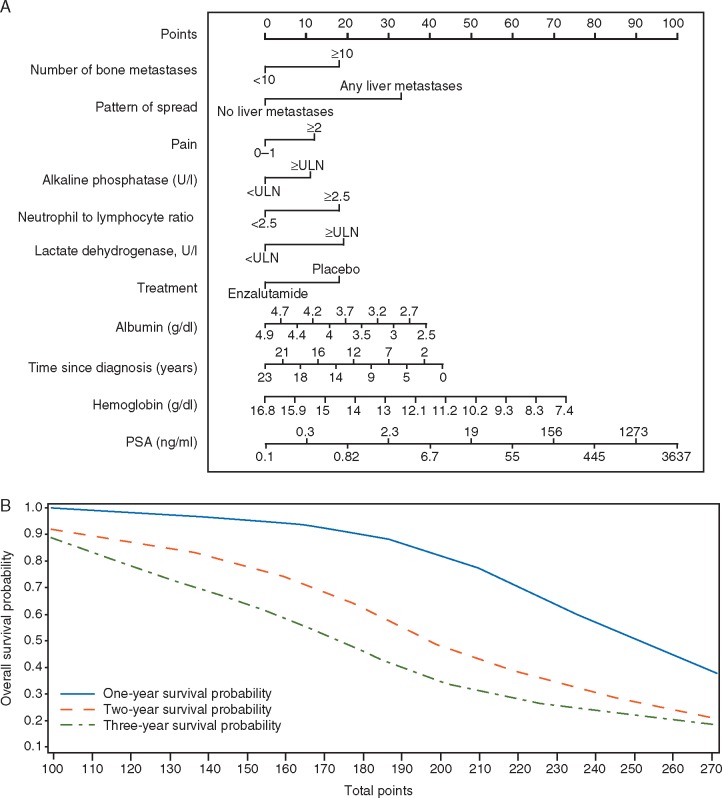
Figure 1.
A nomogram is used to assign each of 11 prognostic factors with a point range from 0 to 100 in a graphic interface, based on the estimated regression coefficients from the final multivariable Cox proportional hazards model predicting overall survival (OS). The nomogram results match with the algorithm. The 1-, 2-, and 3-year survival probability versus total points were also generated to allow the clinical partition to predict OS. The nomogram was developed using SAS® enterprise version 7.1 and is based on the following article: http://support.sas.com/resources/papers/proceedings13/264-2013.pdf. Instructions to physicians: All of the 11 prognostic factors should be available before using this model. Start from the second top axis by identifying the number of bone metastases. Draw a vertical line to the points axis (top line) to represent the number of prognostic points the patients will receive for number of bone metastases. Do the same for the other prognostic variables. Once all prognostic points for the predictors have been determined, add up the prognostic points for each prognostic variable. On the basis of the total points, one can determine the 1-year survival probability by drawing a vertical line from the total points x-axis to the survival probability. The same process can be performed to estimate the 2-year and 3-year survival probability.

