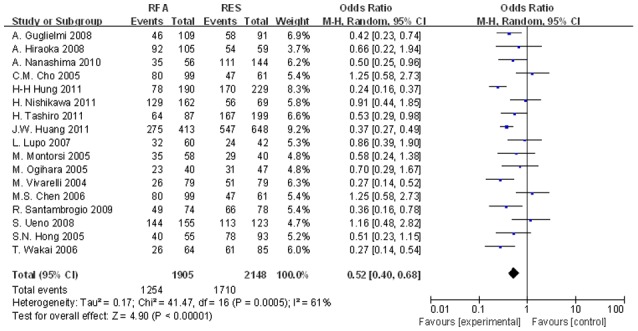
Figure 3.

Significant differences in the 3-year OS rates between the two groups were observed (OR, 0.530; 95% CI, 0.401–0.700; P<0.001). OS, overall survival; OR, odds ratio; CI, confidence interval.

Significant differences in the 3-year OS rates between the two groups were observed (OR, 0.530; 95% CI, 0.401–0.700; P<0.001). OS, overall survival; OR, odds ratio; CI, confidence interval.