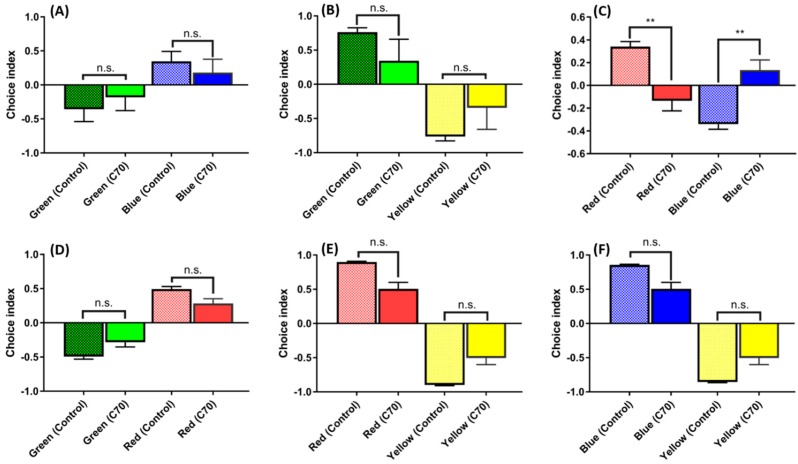
Figure 5.
Comparison of color preferences between the untreated control and 1.5 ppm of C70 NP-exposed fish: (A) green vs. blue combination; (B) green vs. yellow combination; (C) red vs. blue combination; (D) green vs. red combination; (E) red vs. yellow combination; and (F) blue vs. yellow combination. Since all of the data were not normally distributed, they were analyzed using non-parametric Kruskal–Wallis followed by Dunn’s post-hoc test, and p < 0.05 was considered significantly different. The data are presented with mean ± SEM with n = 24, n.s. = not significant, ** p < 0.01.

