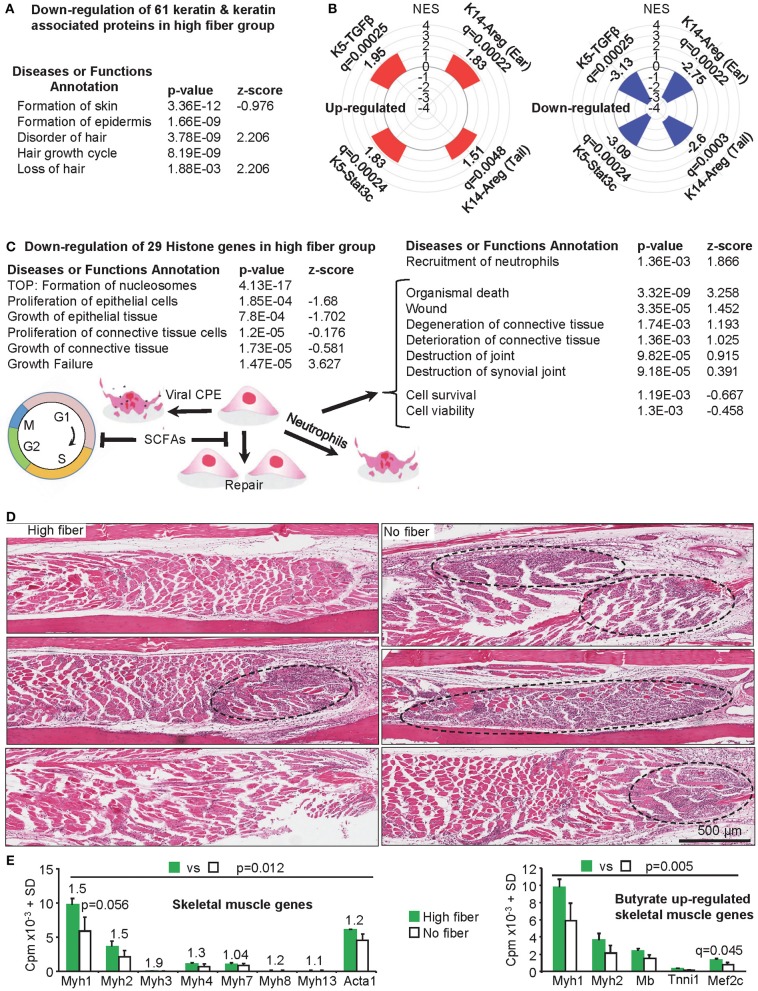
Figure 4.
Additional changes mediated by a high fiber diet. (A) Skin and hair changes. The RNA-Seq data shows a significant down-regulation of 61 keratin and keratin associated proteins (Supplementary Table 1f). When the DEG list (Supplementary Table 1b, q < 0.05) was analyzed by IPA (direct only) using the Diseases or Functions Annotation feature, a range of annotations associated with skin and hair were identified (Supplementary Table 1d); the top four skin and hair annotations by p-value are shown. (B) Gene Set Enrichment Analyses was performed for up and down-regulated DEGs from high vs. no fiber diet (Supplementary Table 1b) and compared with gene sets pre-ranked by log2FC of inflammatory psoriasis mouse models (microarray study GSE27628): K14-Areg, over-expression of human amphiregulin in the basal epidermal layer (tail and skin); K5-Stat3c, basal keratinocyte-specific over-expression of a constitutively active mutant of signal transducer and activator of transcription 3; K5-TGFβ over-expression of the latent form of transforming growth factor β1 in basal keratinocyte. NES, Normalized Enrichment Score; q, FDR adjusted p-value. (C) Histone, proliferation and tissue destruction signatures. The RNA-Seq data shows a significant down-regulation of 29 histone genes in the high fiber group (Supplementary Table 1h). Formation of nucleosomes was the top Diseases or Functions Annotation by p-value (IPA analysis as in A), with a series of proliferation and growth annotations also returned with negative z-scores. The same analysis also returned a series of annotations associated with tissue destruction (right hand table) (Supplementary Table 1d). SCFAs (butyrate, propionate and valerate) can promote G1 cell cycle arrest and may thus inhibit proliferative replacement and repair of damaged tissues. CPE would contribute to tissue damage and neutrophils may also promote tissue destruction. (D) Skeletal muscle. H&E of skeletal muscle in feet of mice fed a high and no fiber diet day 6.5 post CHIKV infection are shown (three images from three mice per group). Muscle fibers (staining red/pink) appeared more extensively replaced by nuclear blue/purple staining of infiltrating inflammatory leukocytes in the no fiber group, with the latter also containing larger areas of dense blue/purple staining (dashed black ovals). (E) Left bar graph; mouse skeletal muscle myosin heavy chain and actin gene mean read counts (using read counts from Supplementary Table 1a). Numbers above the bars are fold change. No individual gene reached significance (q < 0.05); Myh1 approached significance by p-value. However, taken together significance was reached; statistics by Related Samples Wilcoxon Signed Rank Test. Right bar graph: skeletal muscle genes reported to be up-regulated by butyrate (121) were also up-regulated in the high fiber group, although only Mef2c reached significance. Taking the 5 genes together, differences between high fiber and no fiber reached significance; statistics by Related Samples Wilcoxon Signed Rank Test. For both graphs, SDs were derived from three biological replicates (Supplementary Table 1a).

