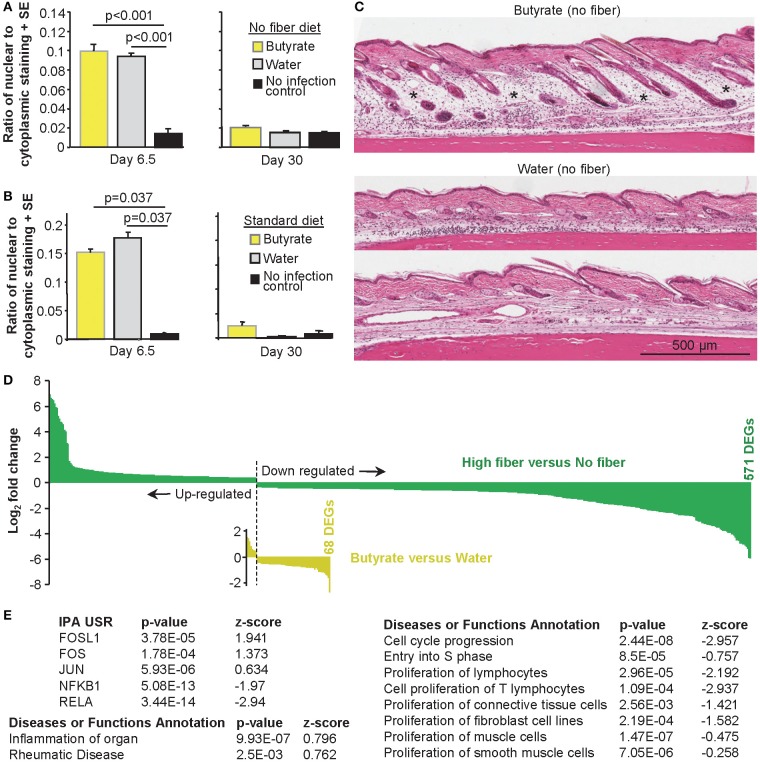
Figure 6.
The effects of butyrate on CHIKV rheumatic disease. (A) Mice were fed a no fiber diet and given water supplemented with and without butyrate as in Figure 1E. On the indicated day, feet were examined by H&E and Aperio pixel count as in Figure 3A. Statistics by t-tests, n = 6 mice and feet per group. (B) As for (A), but mice were fed on a standard diet as in Figure 1C. Statistics by Kolmogorov–Smirnov tests n = 3–6 feet and mice per group. (C) H&E images of foot sections of mice treated as in (A). *Edema. (D) Bar graph of fold change of all 571 DEGs (q < 0.05) for high fiber vs. no fiber (green) and 68 DEGs for butyrate vs. water (yellow). Full data sets available in Supplementary Tables 1b,k. (E) IPA USR and Diseases or Functions Annotation analyses (direct only) of the 68 butyrate DEGs. Full data sets available in Supplementary Tables 1l,n.

