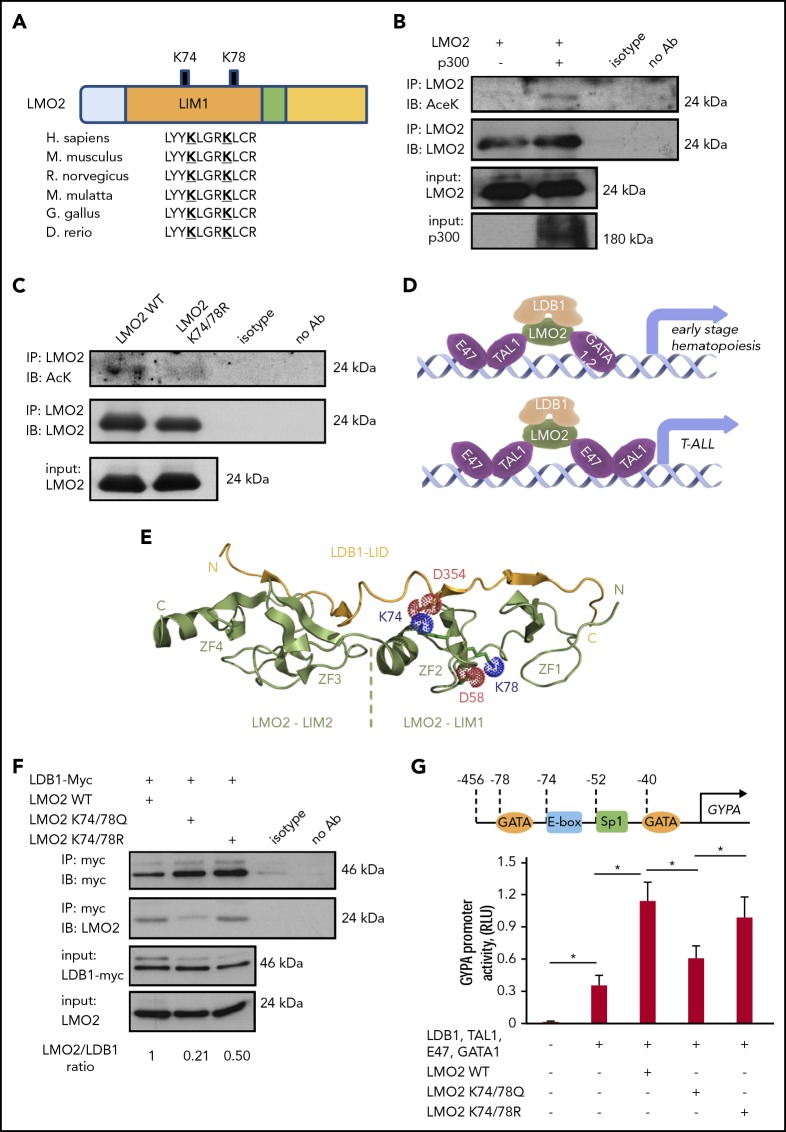
Figure 1.
Lysine deacetylation of LMO2 is essential for the LDB1 interaction and transcriptional activity of the TAL1 complex. (A) Schematic of the LMO2 protein showing 2 putative lysines in LMO2 (K74 and K78) within the LIM1 domain that could be deacetylated (bold and underlined) based on in silico analysis. (B-C) Immunoprecipitation (IP) assay of the lysates of HEK293T cells transfected with expression vectors of p300 and WT or K74/78R LMO2 mutant. IP and immunoblot were performed with indicated antibodies. IPs were performed twice; representative western blot images are depicted. (D) Schematic of the activation of target genes during early hematopoiesis (upper) and T-ALL leukemogenesis (lower) by binding of the TAL1 complex (consisting of E47, TAL1, LDB1, LMO2, and GATA1/2 proteins) to the specific putative regions on the gene promoters. (E) Crystal structure of the LMO2:LDB1-LID complex (PDB 2XJY), highlighting electrostatic interactions of the deacetylated lysines 74 and 78 of LMO2 (green). The lysines and neighboring aspartates, D58 from LMO2-LIM1 and D354 from LDB1 (yellow), are shown as sticks; their cationic ammonium and anionic carboxylate groups are outlined with dotted spheres representing their van der Waals radii. If the lysines were acetylated, they would carry 0 net-charge and could not complement the negative charge of the aspartates. N and C termini and the individual zinc fingers (ZF1-ZF4) are labeled. (F) Co-IP of LMO2 and LDB1 proteins in lysates of HEK293T cells transfected with indicated expression vectors. IP and immunoblot were performed with indicated antibodies. Representative western blot images are depicted. (G) Activity of GYPA reporter containing the 456-bp upstream region of GYPA with putative binding sites for the TAL1 complex (upper). HEK293T cells were transfected with GYPA reporter construct and the indicated expression vectors. The activation of GYPA reporter was measured as described in “Methods." Data show means ± standard deviation (SD) (n = 8). *P < .05.

