Figure 2.
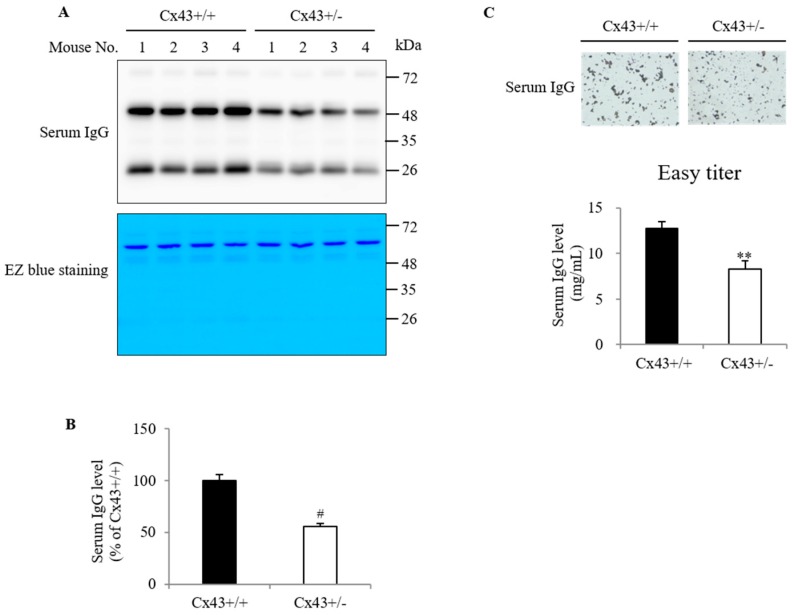
Serum IgG levels in Cx43+/+ and Cx43+/− mice. Serum IgG levels in Cx43+/+ and Cx43+/− mice were determined using Western blot analysis (A,B) and Easy-Titer assay (C). The membrane used for Western blot analysis was also stained with EZ blue for confirmation of the equal loading of the samples (A: lower panel). Note the same intensity of the band at MW around 66 kDa between Cx43+/+ and Cx43+/− mice. The densitometric quantitation of IgG bands in (A) is shown in (B). Data shown are mean ± SE (n = 10). # p < 0.001. (C) Determination of serum IgG concentration using Easy-Titer assay. Serum samples were allowed to react with anti-mouse IgG-coated microbeads, as described in the section of Materials and Methods. The agglutination of the microbeads was photographed (C: upper part; magnification 200×). Note the obvious difference in the size of the aggregates after reaction with Cx43+/+ and Cx43+/− mouse serum. The concentration of serum IgG calculated from the standard curve, generated from monoclonal antibody 1-22-3, is shown in (C) (lower part). Data shown are mean ± SE (n = 4). ** p < 0.01.

