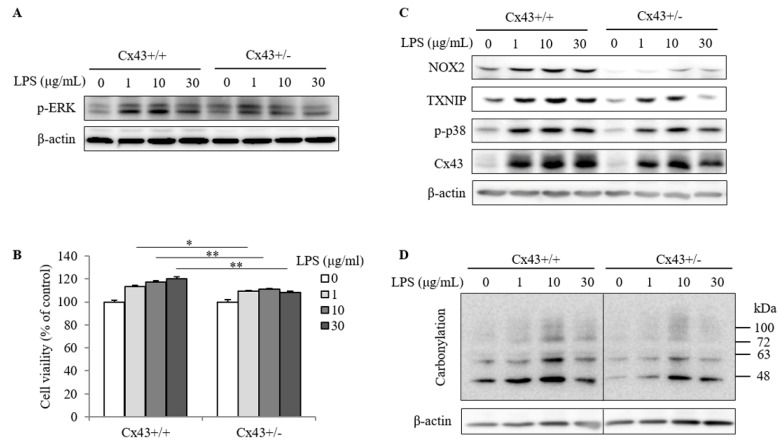
Figure 4.
Responses of Cx43+/+ and Cx43+/− spleen cells to LPS-induced changes in proliferation and redox status. (A,B) Different cell responses to LPS-induced ERK activation and cell proliferation. Spleen cells isolated from Cx43+/+ and Cx43+/− mice were stimulated with the indicated concentrations of LPS for 24 h. Cell lysates were collected and detected for p-ERK using Western blot analysis (A). Cell proliferation after the stimulation was determined using WST assay (B). Data are expressed as the percentage of formazan formation against the untreated control (mean ± SE, n = 4). * p < 0.05, ** p < 0.01. (C) The response of Cx43+/+ and Cx43+/− spleen cells to LPS-induced changes in intracellular oxidative status. Spleen cells were treated the same as above. The cellular proteins were harvested and subjected to Western blot analysis for NOX2, TXNIP, p-p38 and Cx43 (C), as well as protein carbonylation (D). Data in (C) were representative of three separate experiments with similar results.

