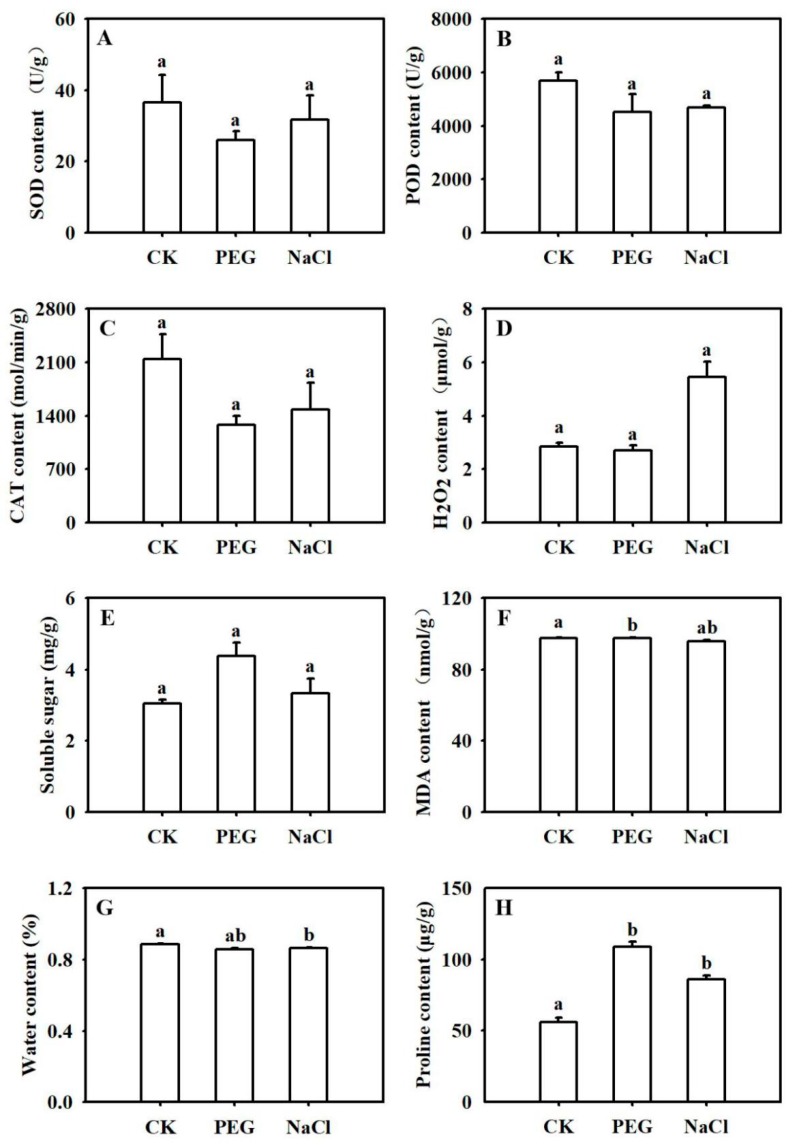
Figure 1.
Effects of drought and salinity stress on physiological and biochemical parameters in B. napus. Superoxide dismutase—SOD (A), peroxidase—POD (B), catalase—CAT (C), H2O2 (D), soluble sugar (E), malondialdehyde—MDA (F), water (G), and proline—PRO (H) contents were determined after 3 h of drought (simulated by polyethylene glycol (PEG)) or salinity (NaCl) treatment. CK represents the control group, (i.e., seedlings treated with ½ Hoagland nutrient solution); PEG represents seedlings treated with 15% (w/v) PEG 6000 plus ½ Hoagland nutrient solution for 3 h. NaCl represents seedlings treated with 150 mM NaCl plus ½ Hoagland nutrient solution for 3 h. Each data point represents the mean of three samples ± SE. Columns with different letters in each graph indicate significant differences based on Duncan’s multiple range tests at p < 0.05 among treatments.

