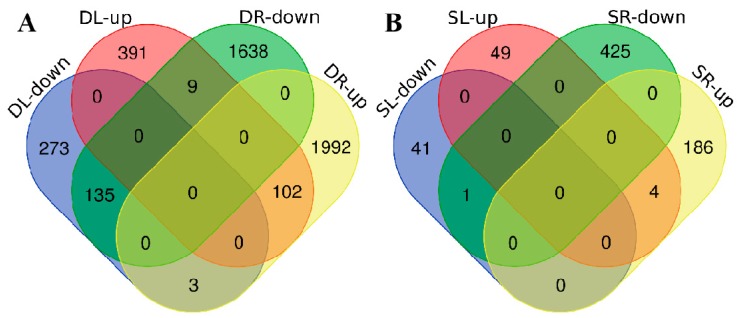
Figure 2.
Venn diagrams of differentially expressed genes (DEGs). (A) DEGs between the control (CK) and drought (simulated by PEG) treatment. DL-down/DR-down indicate downregulated DEGs in leaves/roots under PEG treatment compared to the control. DL-up/DR-up indicate upregulated DEGs in leaves/roots under PEG treatment compared to the control. (B) SL-down/SR-down indicate downregulated DEGs under NaCl treatment compared to the control. SL-up/SR-up indicate upregulated DEGs under NaCl treatment in leaves/roots compared to the control.

