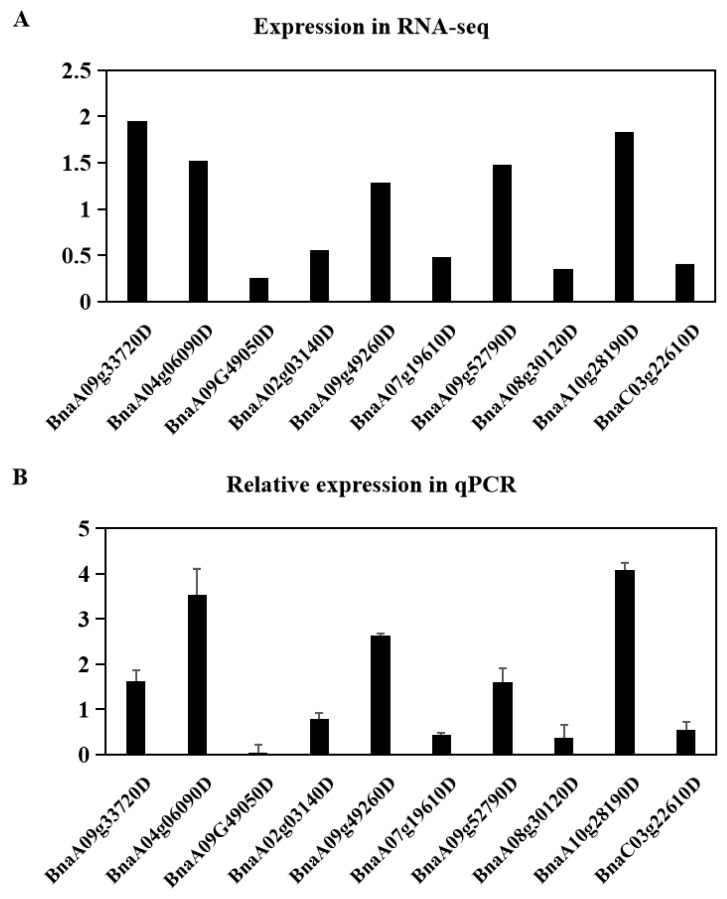
Figure 5.
Relative expression levels of DEGs under drought (simulated by PEG) or salinity stress. Three-week-old rapeseed plants were treated with 15% (w/v) PEG 6000 or 150 mM NaCl for 3 h. (A) The upper panel showed the expression levels of the selected DEGs in RNA-seq data using their fold change value. (B) Total RNA was extracted from the leaves and roots for quantitative PCR (qRT-PCR) analysis. DEG transcript levels were normalized to that of the housekeeping gene β-actin before being compared to the control levels. BnaA09g33720D is a DEG in leaves under PEG treatment, whereas BnaA04g06090D, BnaA09G49050D, BnaA02g03140D, and BnaA09g49260D are DEGs in roots under PEG treatment. BnaA07g19610D and BnaA09g52790D are DEGs in leaves under salinity treatment, whereas BnaA08g30120D, BnaA10g28190D, and BnaC03g22610D are DEGs in roots under salinity treatment. Values represent the means and standard errors (SEs) of three biological samples. Each sample was analyzed by PCR in triplicate. The average expression level of each gene under the control treatment was set to 1.0.

