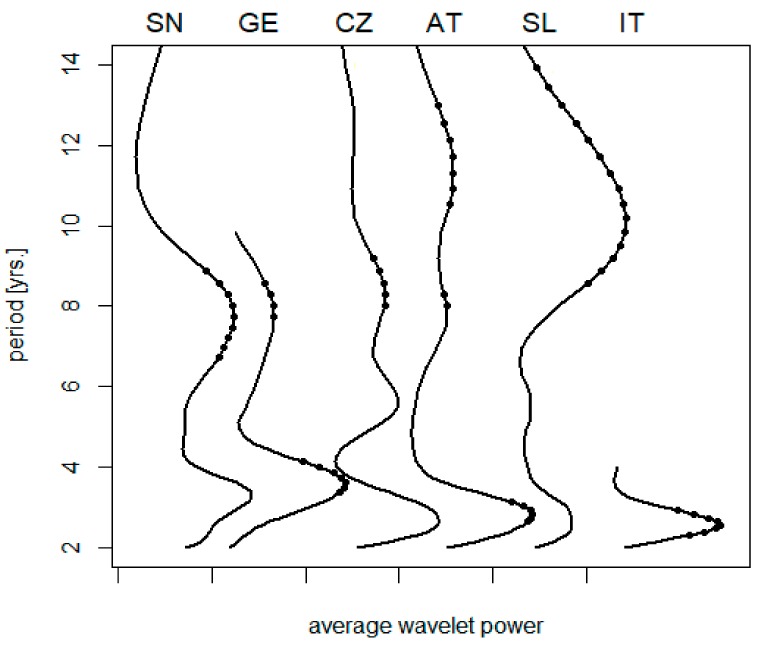
Figure 1.
A collation of average wavelet power spectra of TBE fluctuations: (SN) Sweden, (GE) E. Germany, (CZ) the Czech Rep., (AT) Austria, (SL) Slovenia, and (IT) NE Italy; dots indicate where the signal exceeds random noise with 95% probability (truncated spectra are due to data shortage). For presentation purposes, the diagrams were individually scaled to have the same height of maxima, origins of the scales are marked on the horizontal axis. Note that—unlike the biennial–triennial oscillations—the cycle lengths in the decadal band exhibit a tendency to prolong from the north to south.

