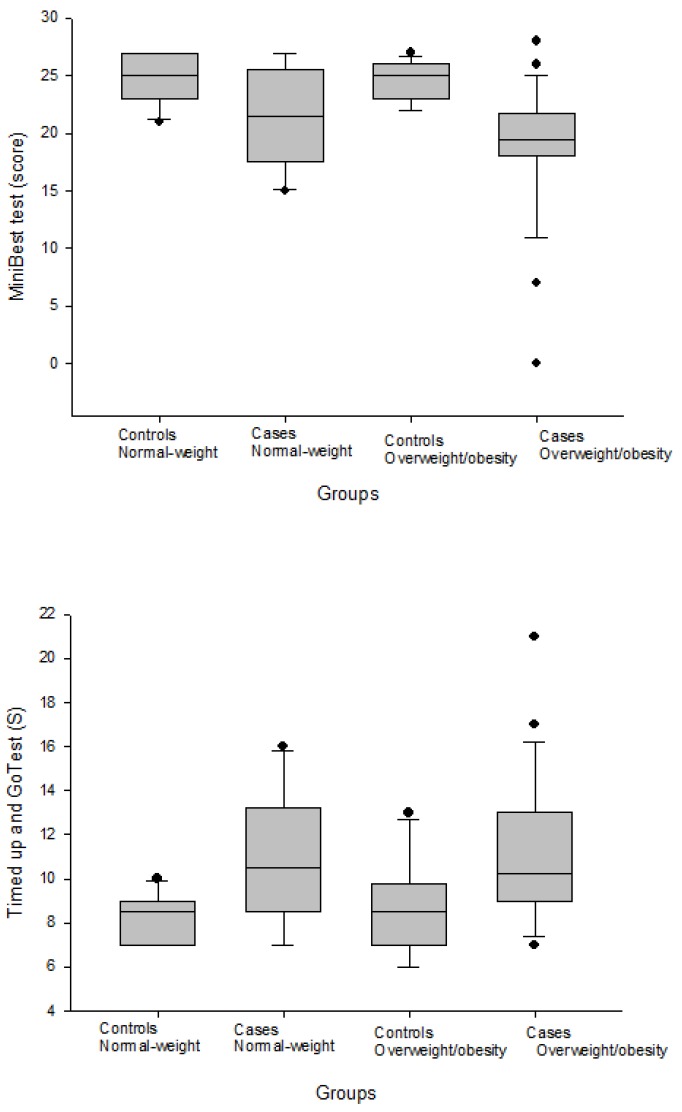
Figure 1.
Levels of dynamic balance measured with the MiniBest and Timed up and go tests in women with fibromyalgia and healthy controls grouped by their body mass index (normal-weight versus overweight/obese). In the box plots, the boundary of the box closest to zero indicates the 25th percentile, the black line within the box marks the median, and the boundary of the box farthest from zero indicates the 75th percentile. Whiskers above and below the box indicate the 10th and 90th percentiles.

