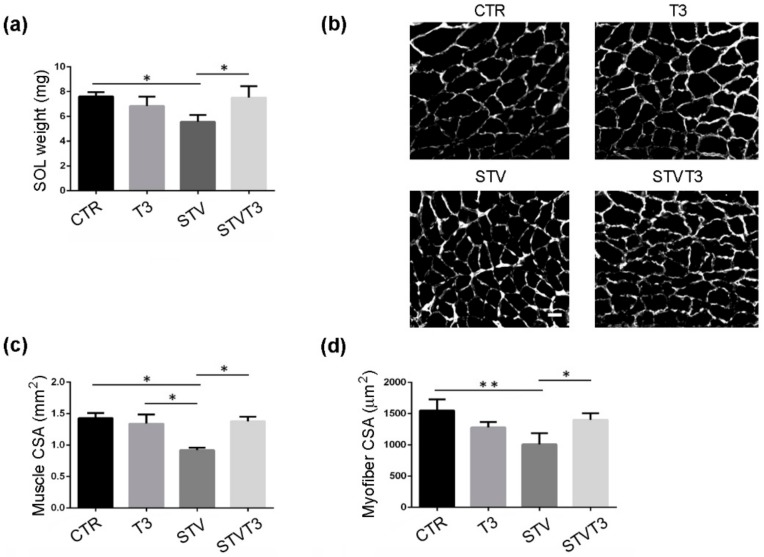
Figure 2.
T3 counteracts starvation-induced skeletal muscle loss in soleus. (a) Soleus muscle weight after 48 h of indicated treatments. n = 3 mice per each condition. Data are presented as means ± SD. STV and T3 significantly interact (p = 0.003) by two-way ANOVA; * p < 0.05 by post hoc Tukey’s HSD test. (b) Representative pictures of soleus muscles with laminin staining, 48 h after starvation. Scale bar = 20 μm. (c) Morphometric analyses of the whole soleus CSA. n = 3 mice per each condition. Data are presented as means ± SD; STV has a significant effect (p = 0.035); STV and T3 significantly interact (p = 0.016) by two-way ANOVA; * p < 0.05 by post hoc Tukey’s HSD test. (d) Morphometric analyses of myofiber CSA. n = 3 mice per each condition. Data are presented as means ± SD; STV has a significant effect (p = 0.017); STV and T3 significantly interact (p = 0.003) by two-way ANOVA; * p < 0.05; ** p < 0.01 by post hoc Tukey’s HSD test.

