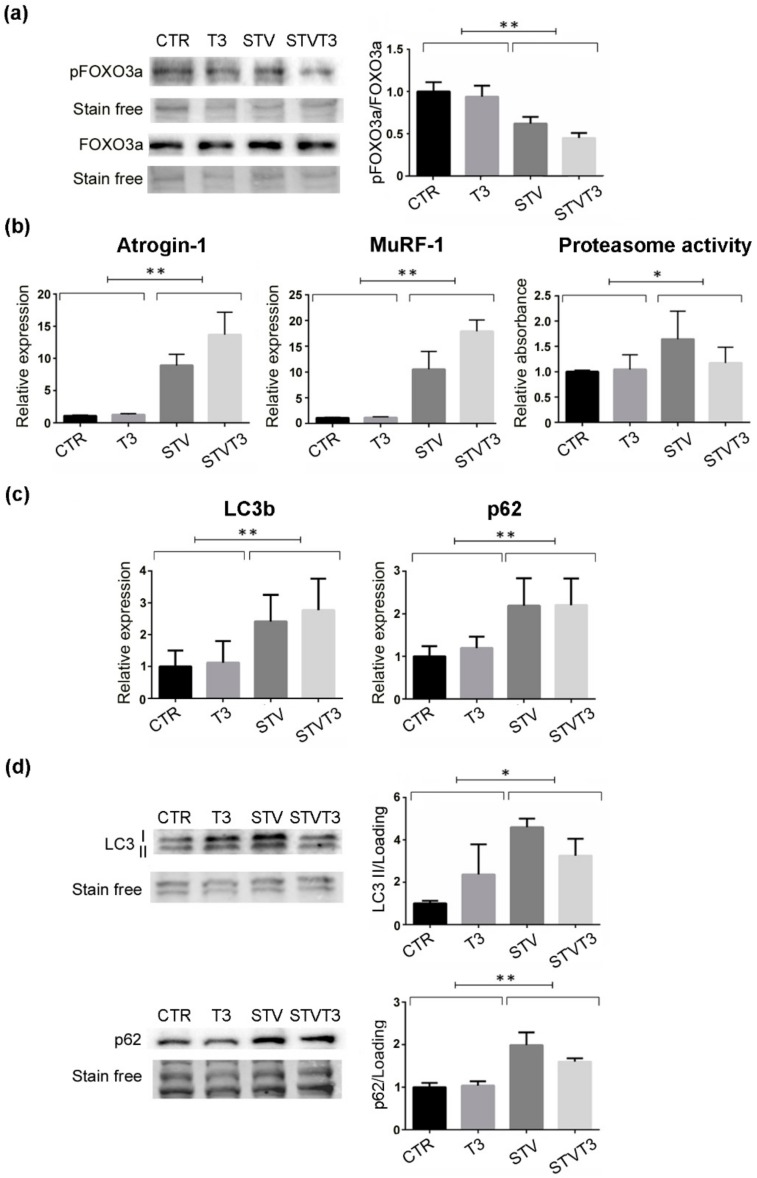
Figure 3.
T3 does not prevent catabolic pathway activation in skeletal muscle upon starvation. (a) Western blot and densitometric analysis of pFOXO3a/FOXO3a protein levels in TA, 24 h after treatments. Stain-free protein bands were used as a loading control. n = 4 mice per each condition. Data are presented as means ± SEM; STV has a significant effect (** p = 0.0001) by two-way ANOVA. (b) Atrogin-1 and MuRF-1 expression by real-time PCR, 24 h after treatments. n = 6 mice per each condition. Data are presented as means ± SD; STV has a significant effect (** p < 0.0001) by two-way ANOVA. Proteasome activity assay, 48 h after starvation; n = 6 mice per each condition. STV has a significant effect (* p = 0.021) by two-way ANOVA. (c) LC3b and p62 expression by real-time PCR, 24 h after treatments. n = 5 mice per each condition. Data are presented as means ± SD; STV has a significant effect (** p ≤ 0.001) by two-way ANOVA. (d) Representative western blot and densitometric analyses of LC3b I/II and p62 protein levels in TA, 24 h after treatments. Stain-free protein bands were used as a loading control. n = 4 mice per each condition. Data are presented as means ± SEM; STV has a significant effect (* p = 0.0149; ** p = 0.001) by two-way ANOVA.

