Figure 4.
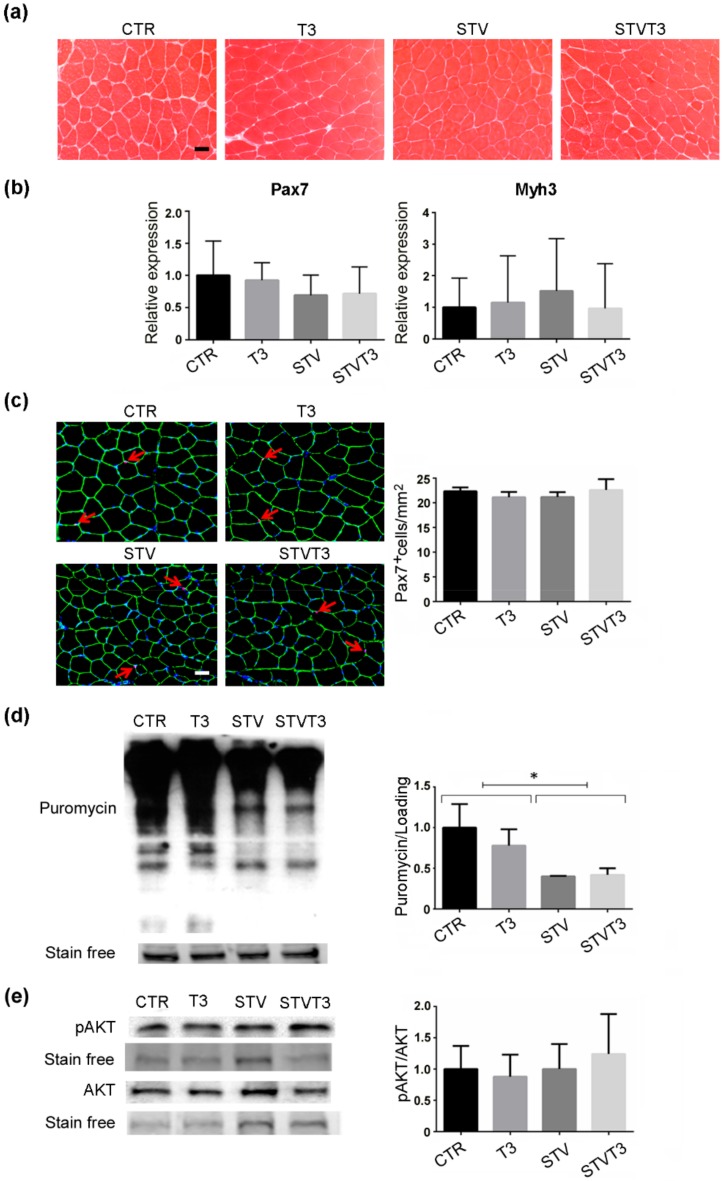
T3 does not increase skeletal muscle anabolism in skeletal muscle following starvation. (a) Representative histological sections of TA muscles, stained with hematoxylin and eosin, showing no evident sign of de novo muscle synthesis, 48 h after treatments. Scale bar = 20 μm. (b) Pax7 and Myh3 mRNA expression, by real-time PCR, 24 hours after treatment. n = 6 mice per each condition. Data are presented as means ± SD. (c) Representative images of TA muscle stained for Pax7 (red arrows), laminin (green), and Hoechst (blue). Scale bar = 20 μm. Quantification of the total number of Pax7+ cells/mm2. n = 3 mice per each condition. (d) SUnSET assay 48 h after treatments. Stain-free protein bands were used as a loading control. n = 4 mice per each condition. Data are presented as means ± SD; STV has a significant effect (* p < 0.008) by two-way ANOVA. (e) Representative blot and relative densitometric analysis of phospho-Akt and Akt protein levels in TA, 24 h after treatments. Stain-free protein bands were used as the loading control. n = 4 mice per each condition. Data are presented as means ± SEM.

