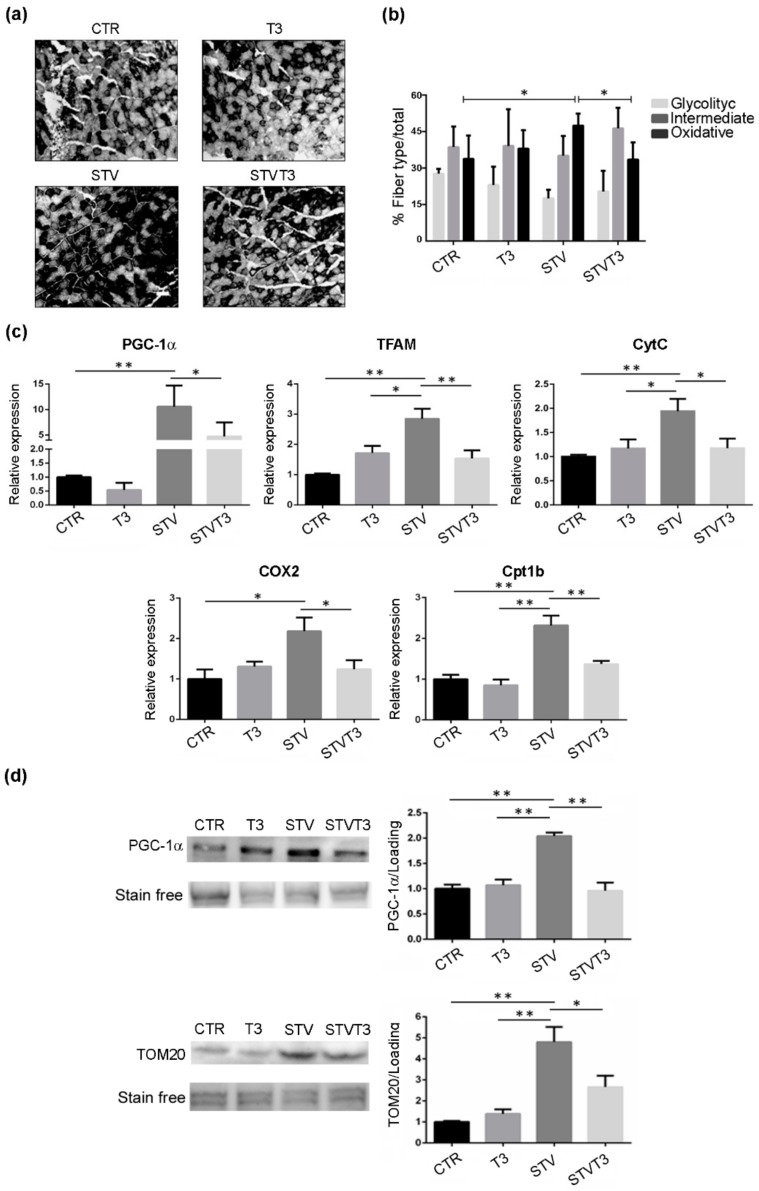
Figure 6.
T3 modulates skeletal muscle metabolism following starvation. (a) Representative pictures of TA muscles stained with NADH, 48 h after treatments. Scale bar = 20 μm. (b) Quantification of oxidative, intermediate, and glycolytic myofibers, relative to total fibers, 48 h after treatments. n = 4 mice per each condition. Data are presented as means ± SD. Only for oxidative fibers: STV and T3 significantly interact (p = 0.009) by two-way ANOVA; * p < 0.05 with post hoc Tukey’s HSD test. (c) Expression levels of indicated genes by real-time PCR, 24 h after treatments. n = 6 mice per each condition. Data are presented as means ± SD. For PGC-1α: STV and T3 significantly interact (p = 0.039) by two-way ANOVA, * p < 0.05 and ** p < 0.01 with post hoc Tukey’s HSD test; for TFAM: STV has a significant effect (p < 0.0001), STV and T3 significantly interact (p < 0.0001), * p < 0.05 and ** p < 0.01 with post hoc Tukey’s HSD test; for CytC: STV has a significant effect (p = 0.019), STV and T3 significantly interact (p = 0.012), * p < 0.05 and ** p < 0.01 with post hoc Tukey’s HSD test; for COX2: STV has a significant effect (p = 0.026), STV and T3 significantly interact (p = 0.008), * p < 0.05 with post hoc Tukey’s HSD test; for Cpt1b: STV has a significant effect (p < 0.0001), STV and T3 significantly interact (p = 0.038), ** p < 0.01 with post hoc Tukey’s HSD test. (d) Representative blots and relative densitometric analyses of PGC-1α and TOM20 protein levels in TA, 24 h after treatments. Stain-free protein bands were used as a loading control. n = 4 mice per each condition. Data are presented as means ± SEM. For PGC-1α:STV has a significant effect (p = 0.0012), STV and T3 significantly interact (p = 0.0002), ** p < 0.01 with post hoc Tukey’s HSD test; for TOM20: STV has a significant effect (p < 0.0001), STV and T3 significantly interact (p = 0.0064) by two-way ANOVA, * p < 0.05 and ** p < 0.01 with post hoc Tukey’s HSD test.

