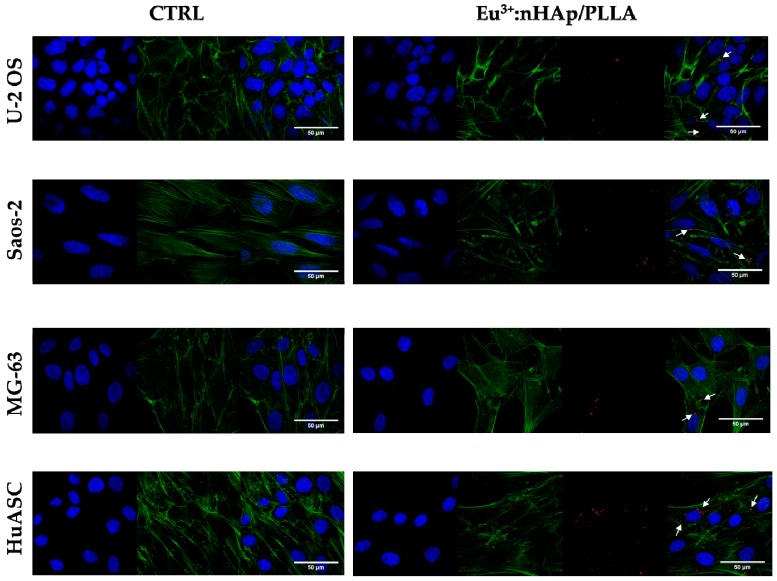
Figure 1.
The comparison of cells morphology in control conditions (i.e., on polystyrene/CTRL) and on biomaterial (10 wt % 3 mol % Eu3+: nanohydroxyapatite (nHAp)/poly(L-lactic acid) PLLA. The morphology of cells was visualized using confocal microscope. Cells were stained with DAPI (blue, nuclei) and phalloidin atto-488 (green, actin cytoskeleton). Additionally, in research groups the Eu3+ ions were visualized (red dots – marked by white cursors). Magnification: 630×, scale bar: 50 µm indicated on merged figure.

