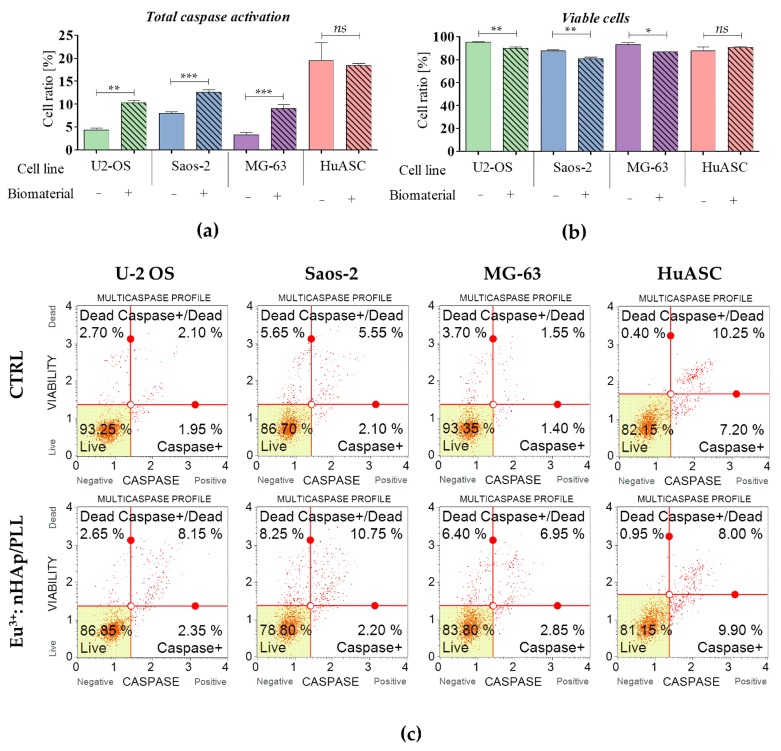
Figure 3.
Caspase activity measured in cultures propagated on a polystyrene (CTRL) and on the scaffold (10 wt % 3 mol % Eu3+: nHAp/PLLA. (a) The comparison analysis of caspase positive cells. (b) Comparison analysis of cells’ viability. (c) The representative graphs obtained during cytometric-based analysis indicate on cells’ distribution based on caspase activation. Cells were separated into four populations: live (Live—bottom left corner), initial activity of caspases (Caspase + - down right corner), advanced activity of caspases (Caspase + / Dead—upper left corner) and dead (Dead – upper right corner). The statistically significant differences were marked with an asterisk (*** p < 0.001; ** p < 0.01, * p < 0.05). Non-significant results of comparison are marked as ns.

