Figure 4.
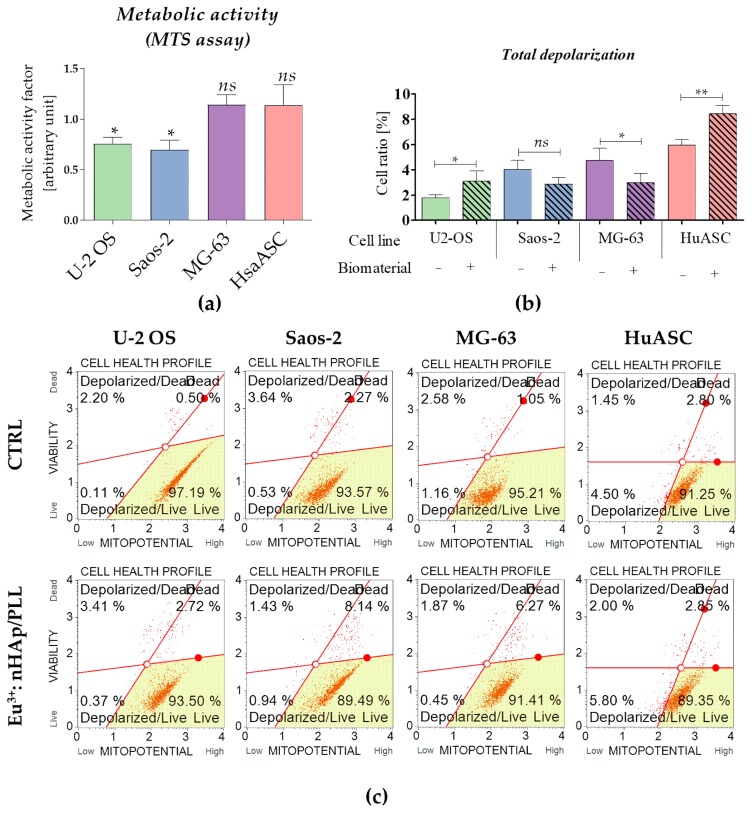
Analysis of cells metabolism in tested culture conditions. (a) Metabolic activity was determined using MTS assay. The arbitrary unit reflecting metabolic activity factor was determined for experimental cultures, in reference to the control cultures (considered as 1 = 100% of metabolic activity). (b) Mitochondria membrane potential was determined using cytometric-based method. Statistical analysis was performed for the cells with depolarized mitochondrial membrane – total depolarized (live and dead) (c) The representative images show distribution of cells based on mitopotential. Cells were separated into four populations: live (Live—bottom right corner), with depolarized mitochondrial membrane and live (Depolarized/Live—bottom left corner), with depolarized mitochondrial membrane and dead (Depolarized / Dead – upper left corner) and dead (Dead—upper right corner). The statistically significant significant differences were marked with an asterisk (*** p < 0.001; ** p < 0.01, * p < 0.05). Non-significant results of comparison are marked as ns.

