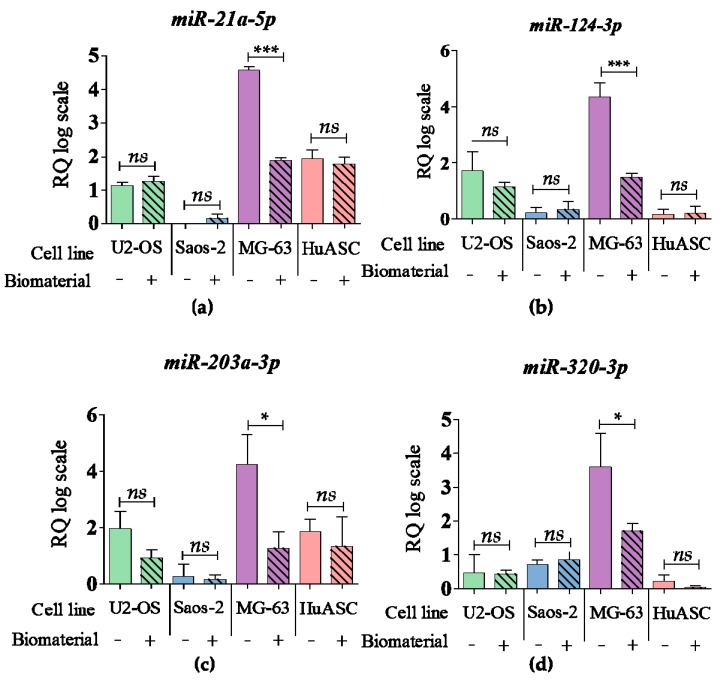
Figure 7.
The analysis of miRNA level. The examined targets were: (a) miR-21a-5p, (b) miR-124-3p, (c) miR-203a-3p, (d) miR-320-3p. An asterisk marks a statistically significant differences determined between tested culture circumstances (* p < 0.05, ** p < 0.01, *** p < 0.001). The expression of miRNA were measured using the RT-qPCR technique, the relative quantification (RQ) was performed using 2-DDCt method and scaling to the sample with highest expression of target gene. The results are expressed as mean ± SD.

