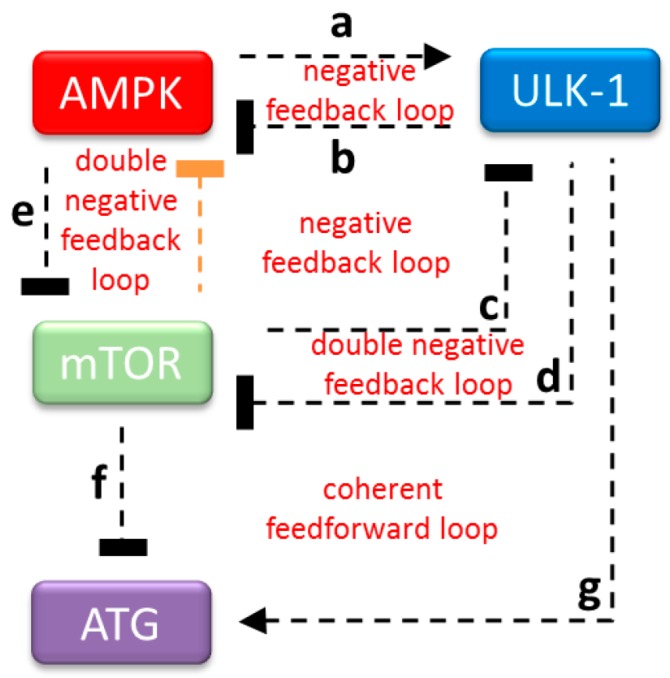
Figure 1.
The wiring diagram of the AMPK–mTOR–ULK1 regulatory triangle controlled stress response mechanism. AMPK, mTOR, and ULK1 are denoted by isolated red, green and blue boxes, respectively. ATG (see purple box) refers to the autophagy activator complex. Dashed line shows how the components can influence each other, while blocked end lines denote inhibition. The feedback loop proven here both experimentally and theoretically is orange-colored.

