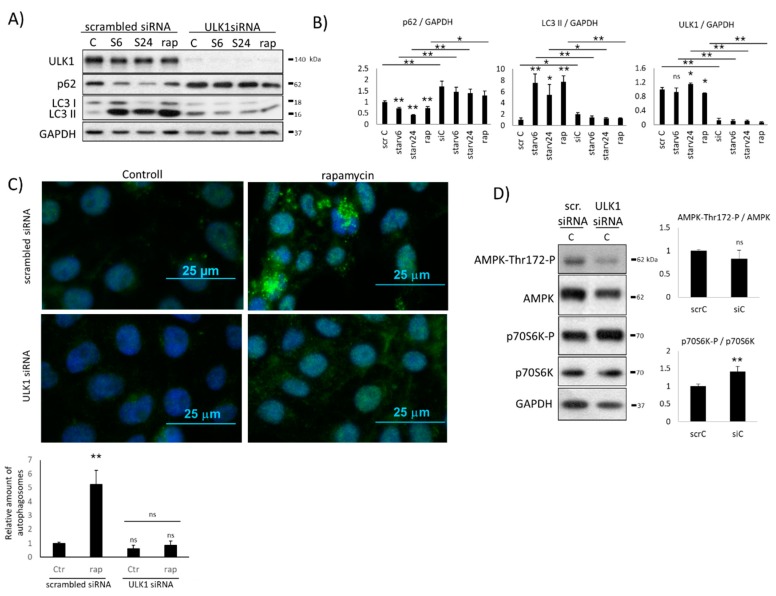
Figure 2.
The effect of ULK1 silencing on the AMPK level under various stress events. HEK293T cells were starved (for 6h or 24h) or treated with rapamycin (rap – rapamycin —100 nM, 2 h) without/with silencing of ULK1 by siRNA. (A) The markers of autophagy (LC3, p62) and ULK1 were followed by immunoblotting. GAPDH was used as the loading control. (B) Densitometry data represent the intensity of p62, ULK1, and LC3 II normalized for GAPDH. (C) The connection of ULK1 silencing and autophagy induction was checked by immunofluorescence microscopy. LC3 was stained by green fluorescence dye. Rapamycin (rap–rapamycin—100 nM, 2h) was used as the positive control. Quantification and statistical analysis of the immunofluorescence microscopy data. Error bars represent standard deviation, asterisks indicate statistically significant difference from the control: ns—nonsignificant; * p < 0.05; ** p < 0.01, (D). The markers of AMPK and mTOR (p70S6K-P) were followed in HEK293T cells without/with silencing of ULK1 by siRNA. Densitometry data represent the intensity p70S6K-P normalized for the total level of p70S6K and AMPK-Thr172-P normalized for the total level of AMPK. For each of the experiments, three independent measurements were carried out. Error bars represent standard deviation, asterisks indicate statistically significant difference from the control: ns—nonsignificant; * p < 0.05; ** p < 0.01.

