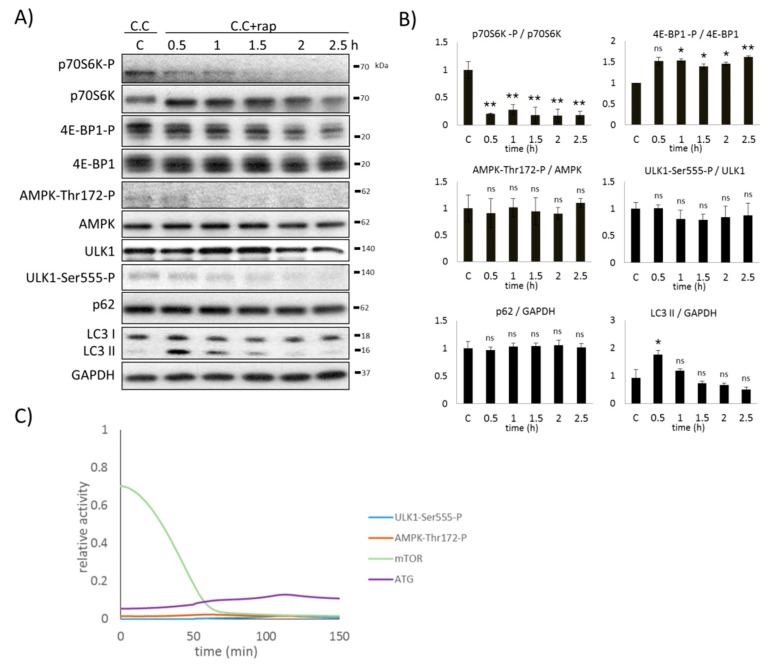
Figure 6.
Inhibition of AMPK arrests ULK1 induction upon rapamycin treatment. HEK293T cells were pre-treated with the AMPK inhibitor, Compound C (2 µM, 0.5 h), followed by 100 nM rapamycin treatment in time. (A) The markers of autophagy (LC3, p62), AMPK, ULK1 (ULK1-Ser555-P), and mTOR (p70S6K-P, 4E-BP1-P) were followed by immunoblotting. GAPDH was used as the loading control. (B) Densitometry data represent the intensity of p62 and LC3 II normalized for GAPDH, ULK1-Ser555-P normalized for the total level of ULK1, p70S6K-P normalized for the total level of p70S6K, 4E-BP1-P normalized for the total level of 4E-BP1, and AMPK-Thr172-P normalized for the total level of AMPK. For each of the experiments, three independent measurements were carried out. Error bars represent standard deviation, asterisks indicate statistically significant difference from the control: ns—nonsignificant; * p < 0.05; ** p < 0.01. (C) Computer simulation of rapamycin treatment. The relative activity of AMPK-Thr172-P, mTOR, ULK1-Ser555-P, and autophagy (ATG) are plotted in time.

