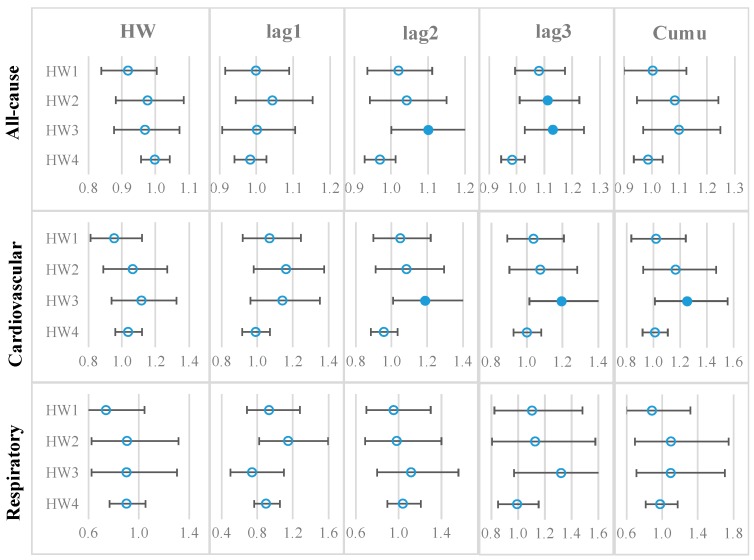
Figure 1.
Relative risks (RRs) of all-cause, cardiovascular, and respiratory mortalities on heatwave days and 1–3 lagged days. Note: Each dot indicates the mean RR, and the error bar indicates the 95% confidence interval (CI). A solid dot denotes that a mean RR is greater than 1 and statistically significant, and an empty dot denotes that a mean RR is statistically not different from 1.

