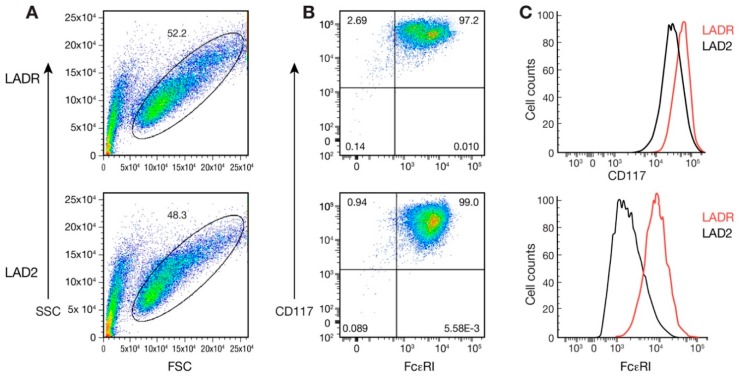
Figure 2.
Flow cytometry studies comparing LADR with LAD2 cells. (A) LADR cells (upper panel) are larger (based on FSC, horizontal axis) and more granulated (based on SSC, vertical axis) when compared with LAD2 cells (lower panel). (B) LADR cells (upper panel) have higher expression of FcεRI (horizontal axis) and CD117 (vertical axis) when compared with LAD2 cells (lower panel), and (C) histograms of CD117 (upper panel) and FcεRI (lower panel) expression comparing LADR (in red) and LAD2 cells (in black) and consistent with results in B.

