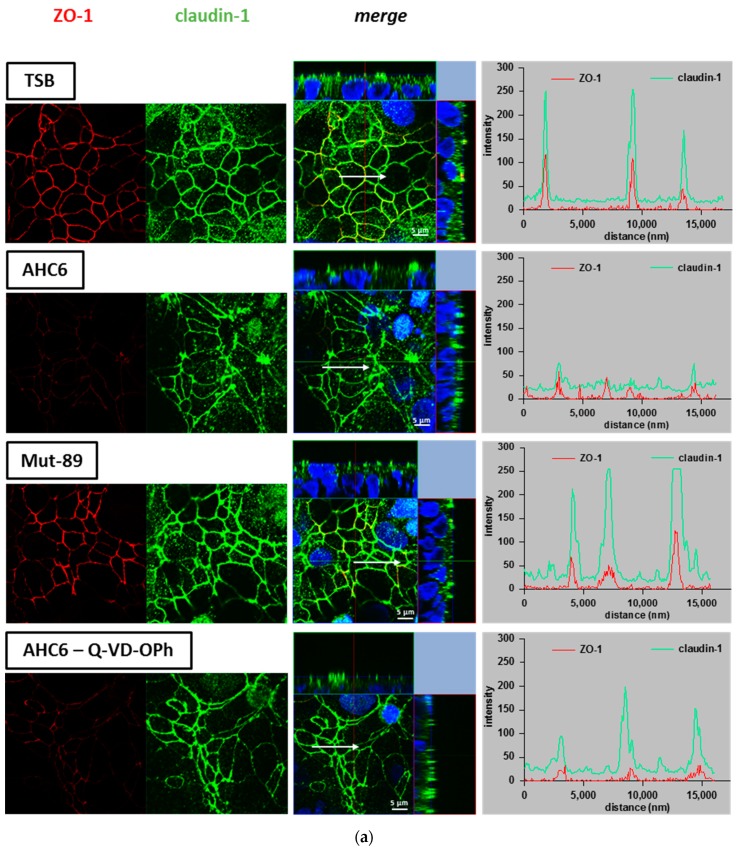
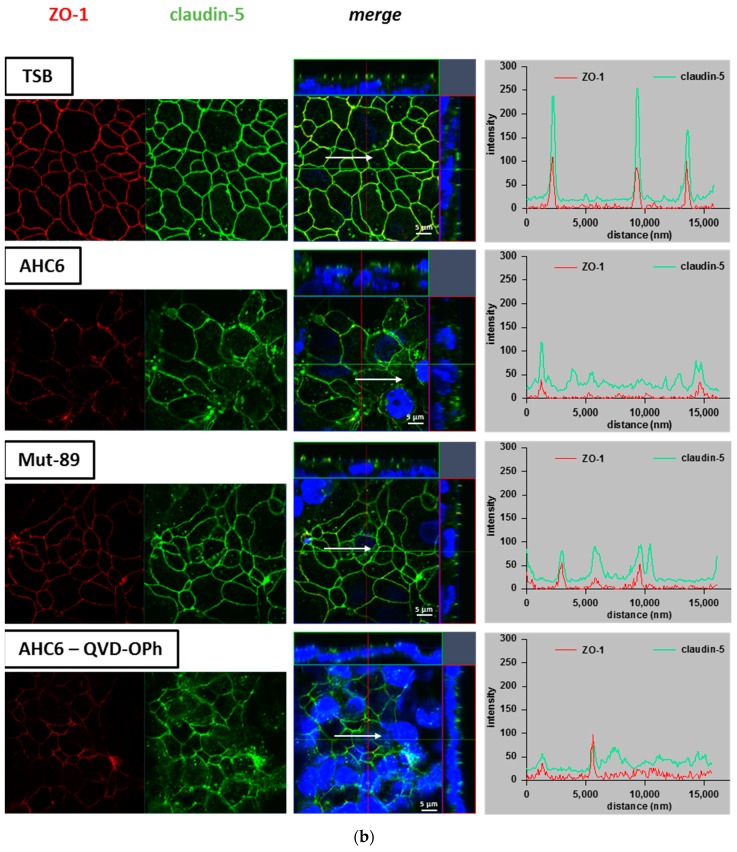
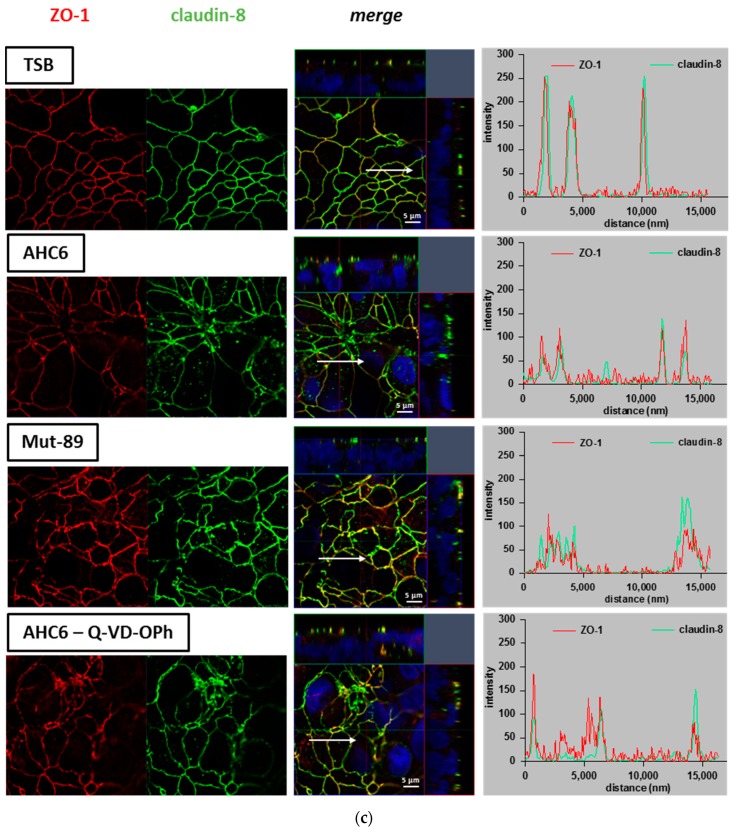
Figure 3.
Redistribution of tight junction proteins in T84 monolayers. T84 monolayers were immunostained after 48 h of challenging with supernatants from AHC6, with or without previous apoptosis inhibition (Q-VD-OPh) or supernatants from Mut-89. TSB-treated monolayers served as control. Immunofluorescence staining of (a) claudin-1, (b) claudin-5, and c) claudin-8 (green) were analyzed by confocal laser scanning microscopy (n = 3 each). ZO-1 (red) served as tight junction marker. Distribution of tight junction proteins was considered by z-stack imaging. Intensity–distance plots show the signal intensity and merging of ZO-1 and claudin signals in representative areas. Arrows were located using Zeiss Zen software and mark the range and direction of the intensity–distance plot. Nuclei were DAPI-stained (4′,6-Diamidin-2-phenylindol; blue).


