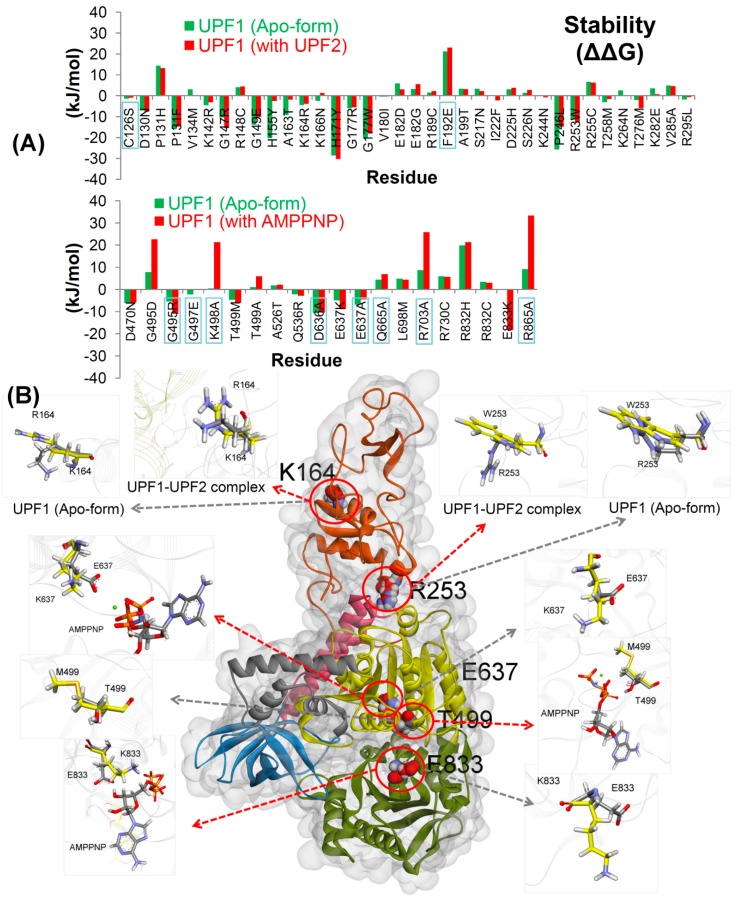
Figure 2.
Effects of mutations on the UPF1 protein. (A) UPF1 structural stability change (∆∆G; kJ/mol) upon mutation. In addition, the mutations from previous studies [4,7,11,13,19,21,32,33] are indicated by labels with the blue box. (B) The UPF1 structure showing mutations studied by MDS. The red arrows represent UPF1 mutations in the complex with UPF2/AMPPNP and the grey arrows show mutations in the apo-form of UPF1. Cα atoms of the wild-type and mutated residues are shown in grey and yellow, respectively (different domains of UPF1 are colored as per Figure 1). Color scheme: oxygen in red, hydrogen in silver, nitrogen in blue, and sulfur in orange.

