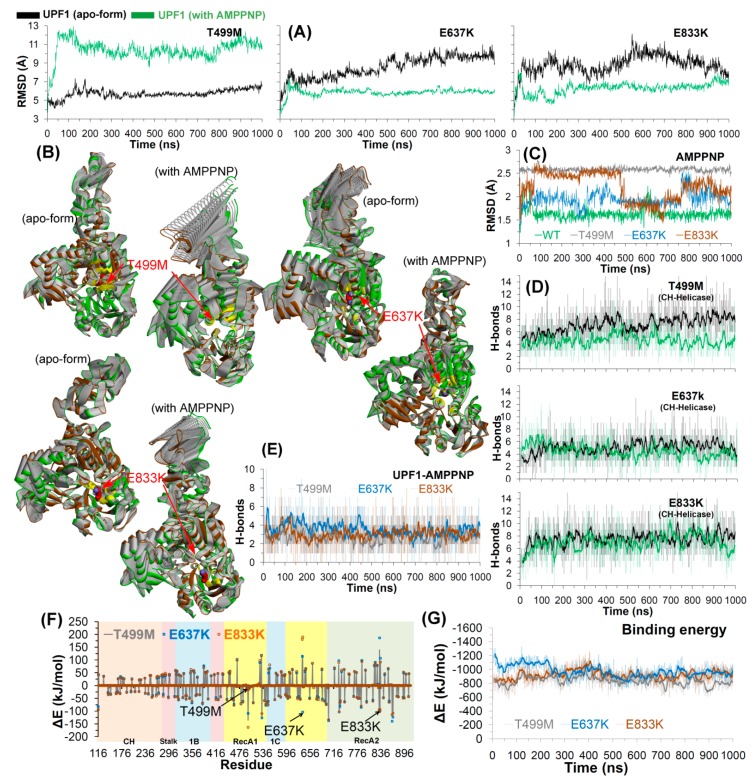
Figure 4.
Structural analysis of T499M, E637K, and E833K mutants in the UPF1 protein. (A) RMSD for all atoms (excluding hydrogens) of mutant UPF1. (B) The principal motion projected along the first eigenvector defined on the basis of the combined trajectories (green marks the beginning and brown is the end of MDS; yellow are residues within 5 Å of the mutated residues). (C) RMSD for all atoms (excluding hydrogens) of AMPPNP from the WT and mutant UPF1-AMPPNP systems. (D,E) Number of hydrogen bonds formed between CH-helicase domains (UPF1 intramolecular) and between UPF1-AMPPNP (intermolecular). The dark lines represent trends with a moving average of H-bonds formed with a period of 10 ns (i.e., number of H-bonds averaged every 10 ns). (F,G) Energy contribution (computed using MM-PBSA) of each residue of UPF1 to the binding with AMPPNP and total binding energy for UPF1-AMPPNP complex, respectively. Contribution of residues selected for mutational analysis are labelled and shown with arrows in (F).

