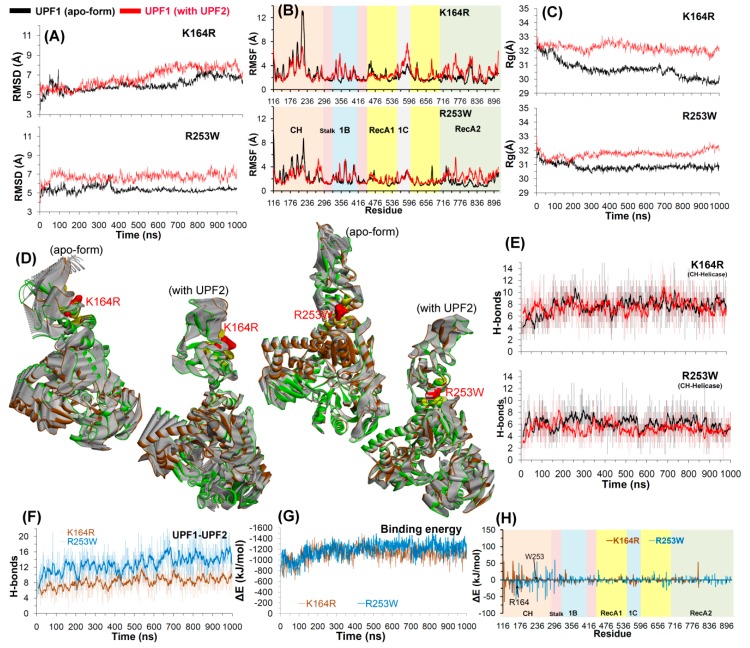
Figure 6.
Structural analysis of UPF1 mutants K164R and R253W. (A–C) RMSD, RMSF, and radius of gyration profiles representing structural changes and fluctuations of UPF1 residues. (D) The motion corresponding to the first eigenvector defined on the basis of the combined trajectories. (E,F) Number of hydrogen bonds formed between CH-helicase domains (UPF1 intramolecular interactions) and between UPF1-UPF2 (intermolecular interactions). The dark lines represent trend with a moving average of H-bonds formed with a period of 10 ns (i.e., number of H-bonds averaged every 10 ns). (G,H) Energy of each residue (of the mutant UPF1) contributing to the binding with UPF2 and total binding energy for UPF1-UPF2, calculated by MM-PBSA.

