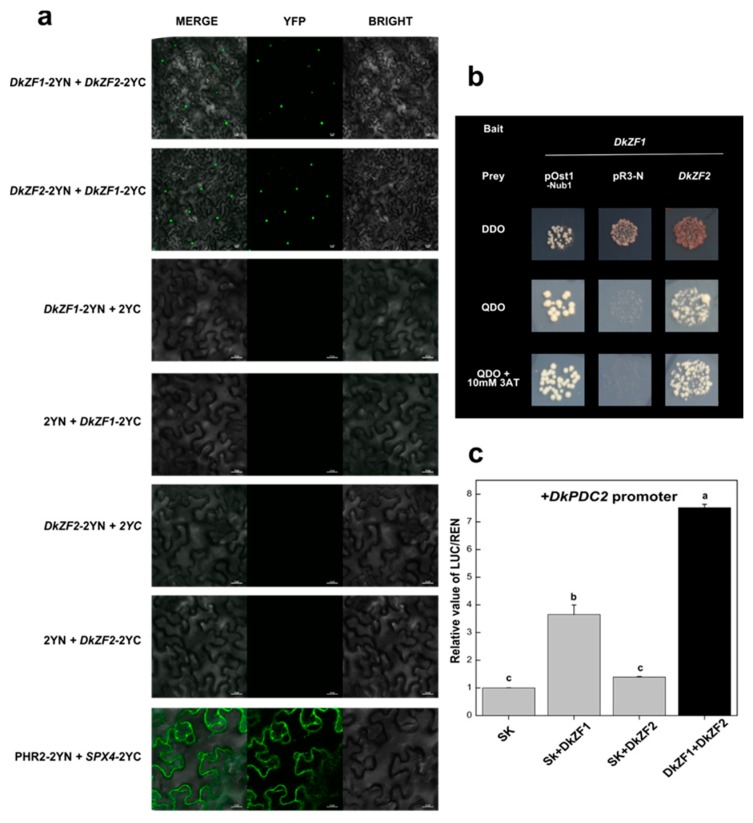
Figure 4.
Protein–protein interactions of DkZF1 and DkZF2 and their synergistic relationship with the DkPDC2 promoter. (a) bimolecular fluorescence complementation (BiFC) assay of DkZF1 and DkZF2 with all possible combinations while merge and YFP florescence indicate protein–protein interactions. Scale bar 25 µm. (b) Y2H assay showed in vivo protein–protein interactions of DkZF1 and DkZF2. The positive control is pOst1–Nub1, while pPR3-N is negative control. (c) Synergistic transactivation effect of combination of DkZF1 and DKZF2 genes on the DkPDC2 promoter. Means with different letters had significant differences (p < 0.05).

