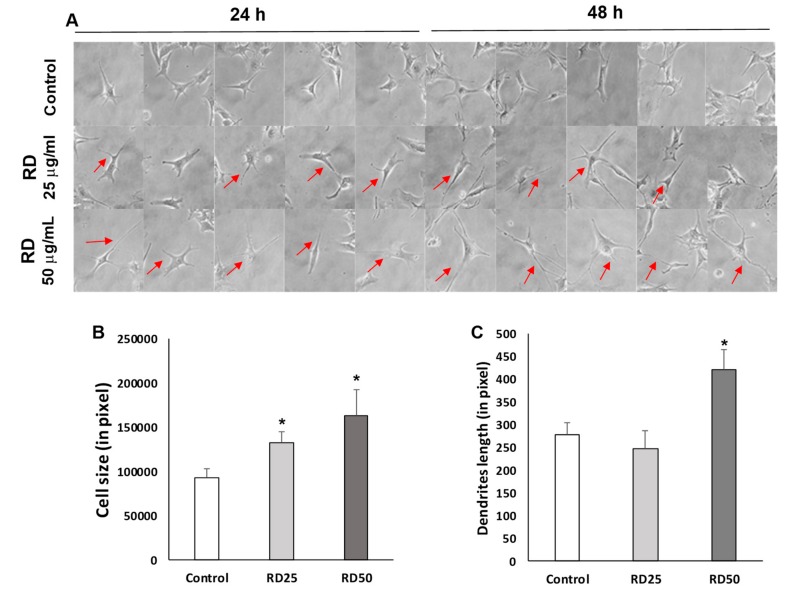
Figure 3.
Increase of cell size and dendrite length by RD. (A) Visual assessment of B16F10 melanoma cells following the exposure to RD. Representative morphological changes were marked with red arrows. (400×) (B) Cell size changes 24 h after the exposure to RD. Polygonal contouring in ImageJ for measurement of cell size. Cell sizes in pixels. Data represent the mean ± SE of more than 6 cells (n ≥ 6). (C) Dendrites length (in pixel) changes 48 h after the exposure to RD. Straight lines in ImageJ for measurement of dendrites length. Dendrites length in pixels. Data represent the mean ± SE of more than 6 cells (n ≥ 6). * p < 0.05 versus DMSO control.

