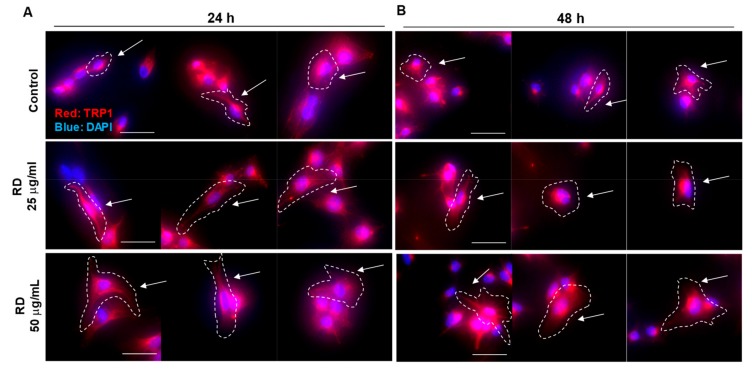
Figure 5.
Increased expression of a melanosomal marker, TRP1. B16F10 cell were treated 0, 25, and 50 μg/mL RD for 24 h (A) and 48 h (B). TRP1 is stained in B16F10 cells by immunocytochemistry. (detected with Alexa Fluor® 594 Goat anti-Mouse, shown in red). Nuclear DNA was labeled with DAPI (shown in blue). Representative morphological changes were marked with white dotted lines and white arrows. Image was taken with a microscope (Nikon Eclipse Ts2R, 400×, scale bar = 50 μm).

