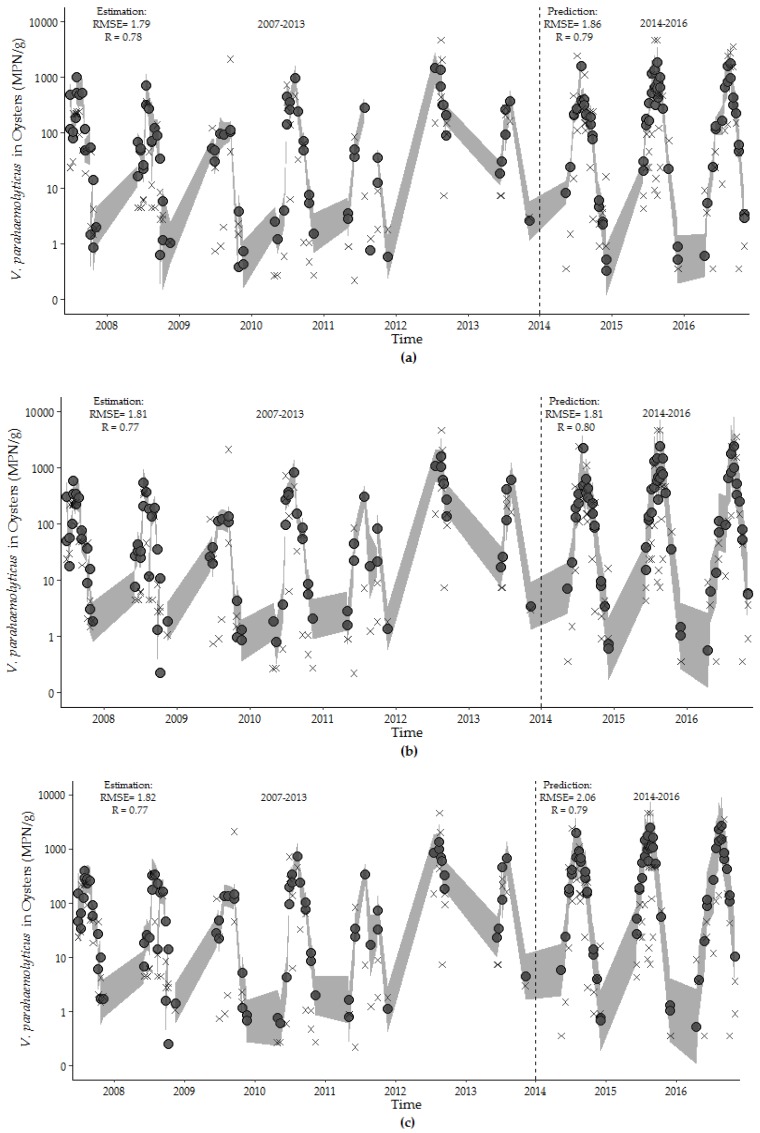
Figure 8.
Estimates of V. parahaemolyticus concentrations (closed circle) with observed V. parahaemolyticus concentrations for: (a) environmental model, (b) hybrid model, and (c) harmonic regression model for the training (2007–2013) and test (2014–2016) periods. The 95th percentile prediction interval is represented by the gray shading. Model fit values are shown in the upper left corner of each figure.

