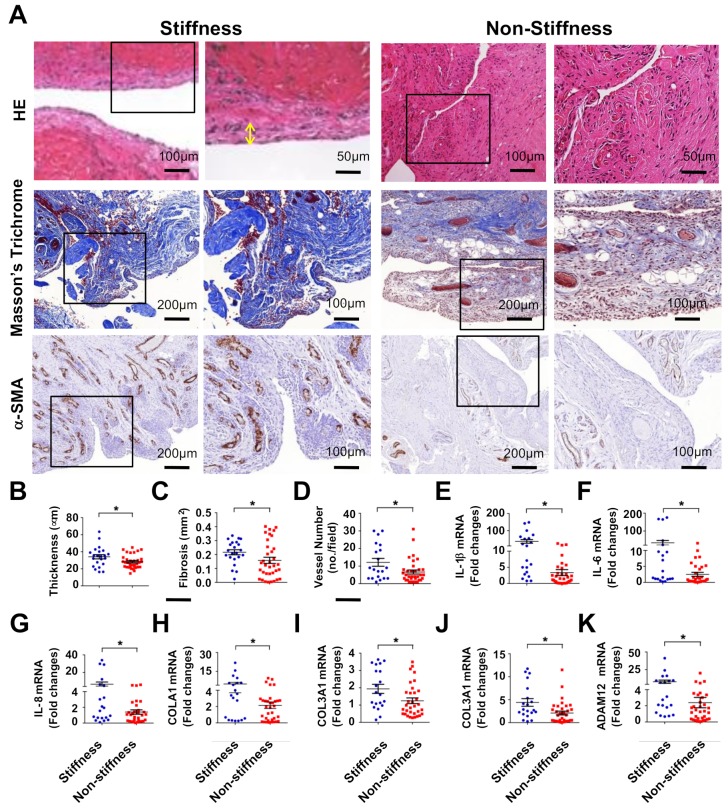
Figure 1.
Analysis of fibrosis histopathology and fibrotic matrix expression of subacromial bursa in patients with rotator cuff lesion with or without stiffness. Subacromial bursa in the stiffness group show hypertrophy (yellow two-way arrow) as evident from hematoxylin and eosin (HE) staining. Masson’s trichrome staining displayed spacious fibrotic tissue (blue) rather than muscle tissue (red) in the stiffness group. Strong α-SMA immunostaining (brown) is exhibited in the stiffness group (A). The boxes stand for selected regions of interest for high power field images shown in panels 2 and 4 Subacromial bursa membrane thickness (B), fibrotic tissue area (C), and vessel formation (D) were significantly increased in the stiffness group. Inflammatory cytokines IL-1β (E), IL-6 (F), IL-8 (G) along with fibrotic matrices COL1A1 (H), COL13A1 (I), COL4A1 (J), and ADAM12 (K) expression were significantly upregulated in the stiffness group. Data are expressed as mean ± standard error of mean (SEM) from 22 patients in the stiffness group and 35 patients in the non-stiffness group. Asterisks (*) indicate significant differences between stiffness and non-stiffness group analyzed using Wilcoxon test (p < 0.05). HE, hematoxylin and eosin; α-SMA, α-smooth muscle actin; IL, interleukin; COL, collagen.

