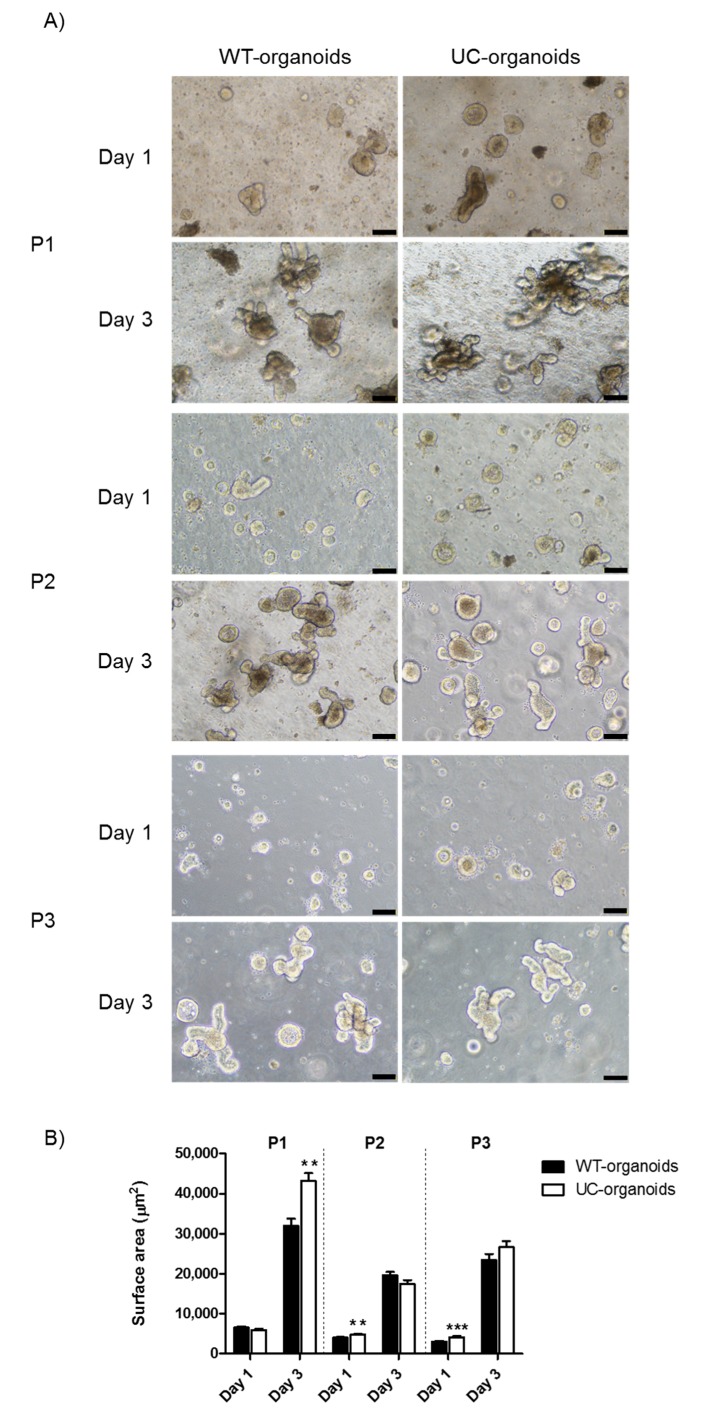
Figure 1.
Proliferation of WT- and UC-organoids over time. (A) Representative images of WT- and UC-organoids on day one and three, after seeding in Matrigel. Magnification 10×, scale bars 100 μm. (B) Average surface area of organoids. Histograms represent mean surface area (μm2) ± SEM of four independent experiments. Unpaired two-tailed Student’s t-test was used for statistical analysis. *** p < 0.001, ** p < 0.01.

