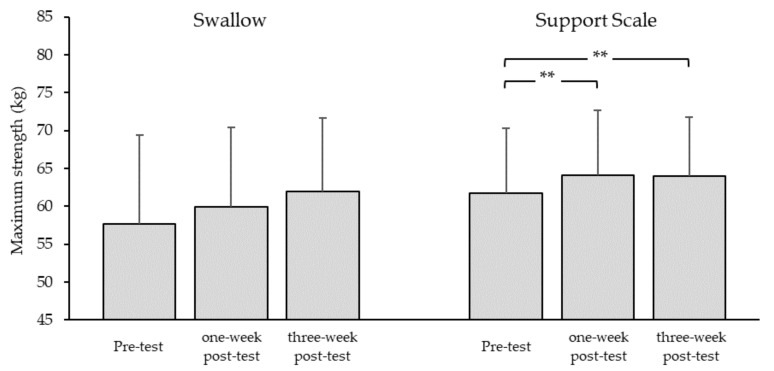
Figure 5.
Maximum strength. Mean values and standard deviations for maximal strength (body mass—counterweight or body mass + additional weight) for the swallow and support scale elements when held for 5 s on rings (n = 8). Pre-test = before training; one-week post-test and three-week post-test = one and three weeks after the four-week eccentric–isokinetic training intervention, respectively; ** significant change: p < 0.01.

