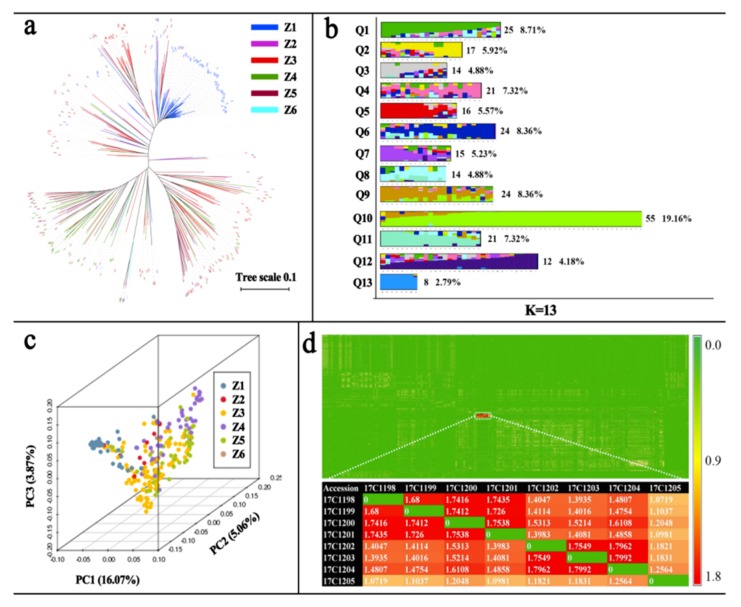
Figure 2.
Population structure analysis for 287 pepper accessions. (a) NJ tree of 287 pepper accessions constructed from simple matching distance of genome SNPs. The Z1, Z2, Z3, Z4, Z5, and Z6 represent fruit shape is lantern, cons, horns (cattle and sheep horns), fingers, linear and the other, respectively. (b) Plots of the first three principal components of 287 pepper accessions. The Z1, Z2, Z3, Z4, Z5, and Z6 represent fruit shape is lantern, cons, horns (cattle and sheep horns), fingers, linear and the other, respectively. (c) Admixture in sub-populations (K = 13) resolved using 9,557,790 SNPs. The accessions were divided into 13 subgroups: Q1–Q13. The values represent accession number and percentage for each group. (d) Relatedness value thermal map of 287 pepper accessions. The color bar represents relatedness value.

