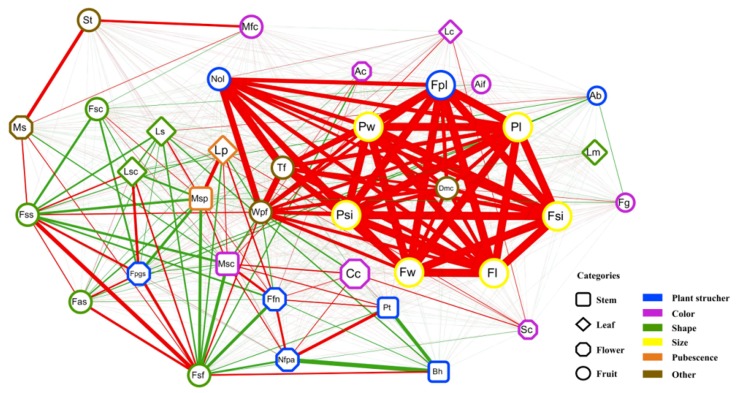
Figure 4.
Phenotype correlation network of agronomic traits in pepper. Red and green lines represent negative and positive correlations, respectively. Line width is proportional to the strength of the correlation. Different shape nodes represent stem-related, leaf-related, flower-related and fruit-related traits, respectively. Different color frames of nodes represent plant structure-related, color-related, shape-related, size-related, pubescence-related and other traits, respectively.

