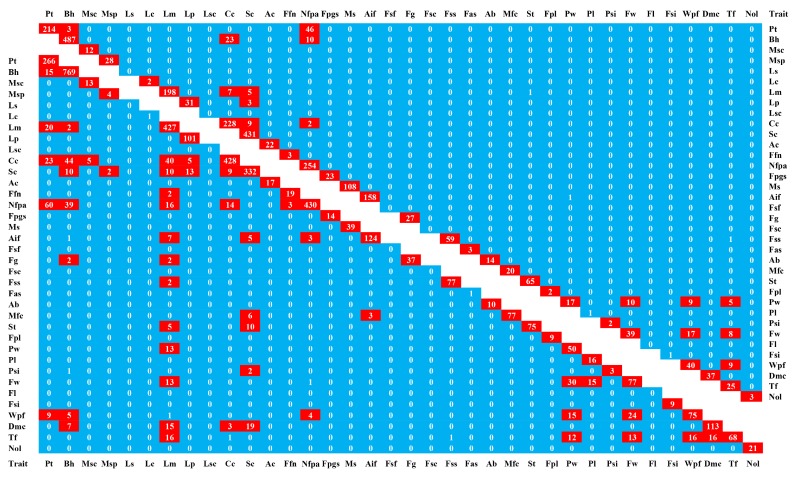
Figure 5.
Significant SNPs and potential candidate gene numbers in pairwise traits. The upper triangle is the significant SNPs numbers in pairwise trits; The lower triangle is the potential candidate gene numbers in pairwise traits. The color bar represents the number of SNPs or candidate genes in pairwise traits.

