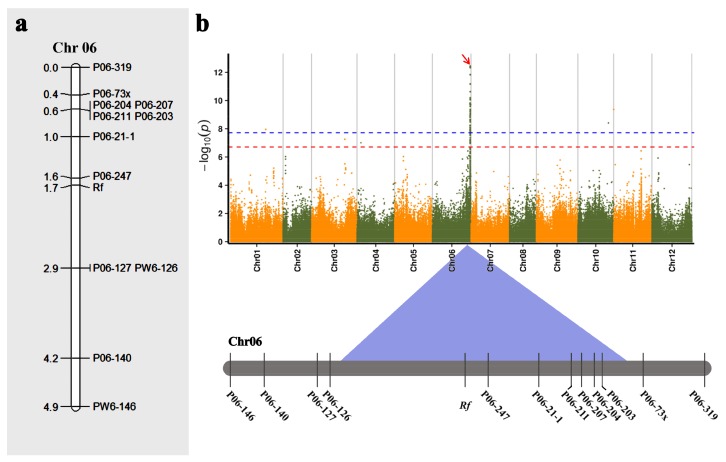
Figure 6.
Comparison of molecular mapping with GWAS signals for Rf gene. (a) the molecular mapping result of Rf. (b) Comparison of the results of molecular mapping and GWAS mapping of Rf (factored spectrally transformed linear mixed (FaST-LMM) model). The red arrow represents the major peaks associated with male-sterility (Rf gene). The highly significant threshold is shown as a dash blue line (p < 1.707 × 10⁻⁸) and the significant threshold is shown as a dash red line (p < 1.707 × 10⁻⁷).

