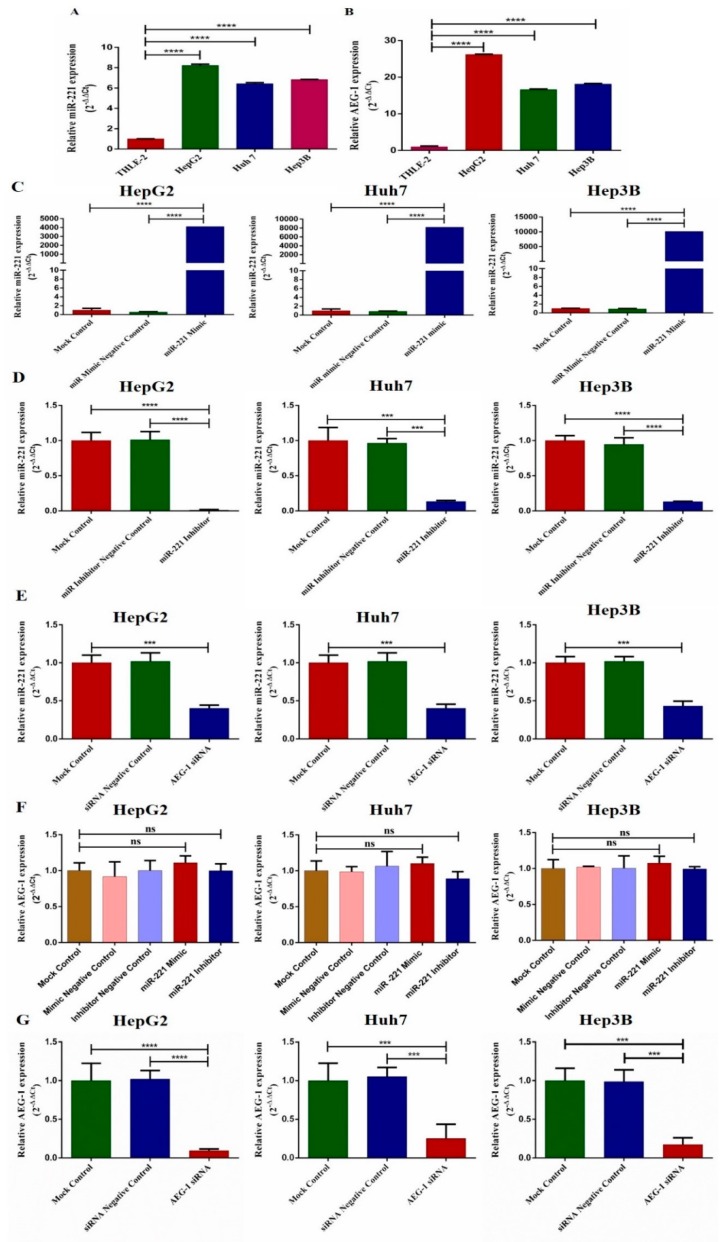
Figure 1.
Relative mRNA expression levels of miR-221 and AEG-1 in normal liver and HCC cell lines. Relative mRNA expression of miR-221 (A) and AEG-1 (B) was analyzed in normal liver and HCC cell lines, the expression of miR-221 in miR-221 mimic (C) and miR-221inhibitor (D) and AEG-1 siRNA (E) transfected HCC cells. Relative expression of AEG-1 in miR-221 mimic, miR-221 inhibitor and their control (F), AEG-1 siRNA and their controls transfected HCC cells (G). All mRNA expressions were performed using qRT-PCR. mRNA expressions were normalized using RNU6 and GAPDH. All reactions were performed in triplicates. Error bars are presented as mean ± s.d. and *** p < 0.001, **** p < 0.0001. ns: non-significance.

