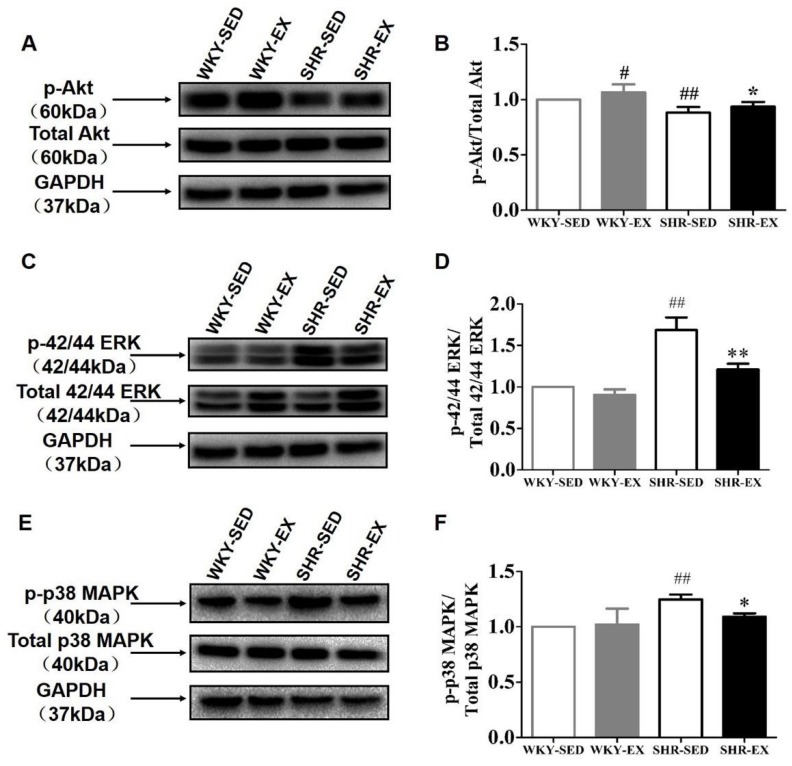
Figure 4.
Analyses of signaling pathways in VSMC phenotype regulation. The phosphorylation levels of Akt, known as protein kinase B, and total protein expression are shown in (A). The phosphorylation levels of ERK (extracellular signal-regulated kinase) and p38 MAPK (mitogen-activated protein kinase) are presented in (C,E). (B,D,F) show the analysis data by using GraphPad Prism 7. (A,C,E) were normalized to their total protein. ## p < 0.01 (versus WKY-SED), ** p < 0.01 and * p < 0.05 (versus SHR-SED) (n = 8 in each group).

