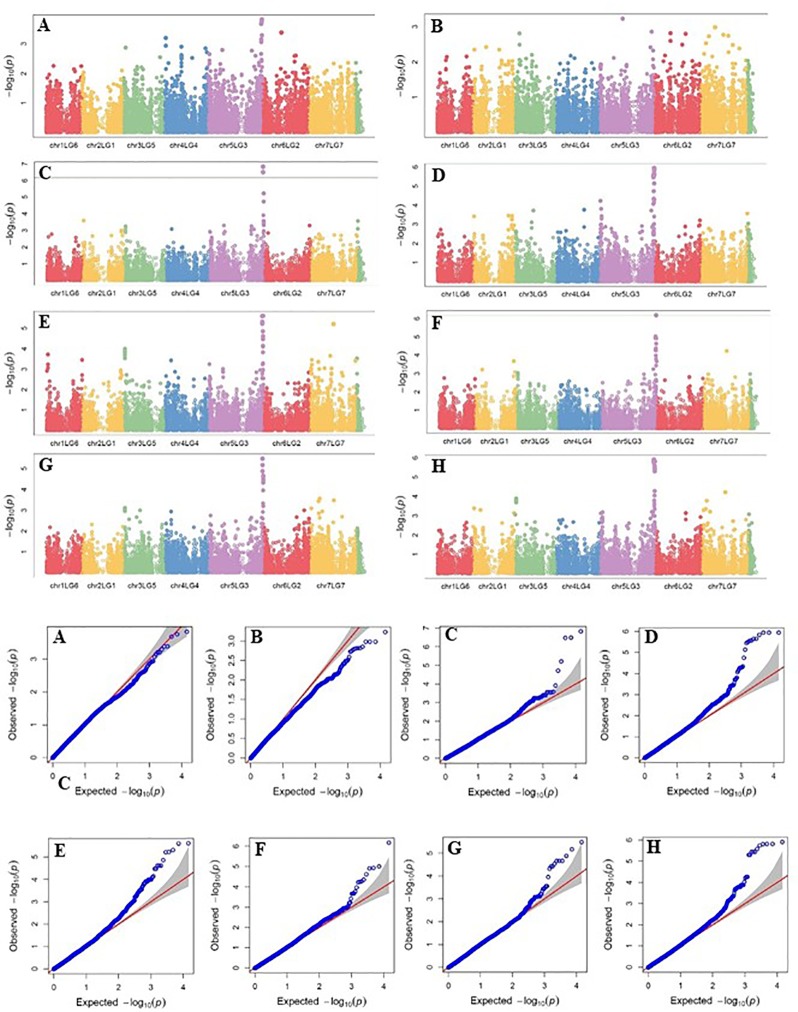
Figure 5.
Manhattan plots and the corresponding Q-Q plots representing the identification of SNP markers associated with plant height in multiple trials. (A) 2013 Fargo (B) 2013 Sutherland, (C) 2014 Sutherland, (D) 2015 Sutherland, (E) 2016 Rosthern, (F) 2016 Sutherland, (G) 2017 Rosthern, and (H) 2017 Sutherland. The Manhattan plots are based on association of 15608 chromosomal and1269 non-chromosomal SNPs with plant height of 135 pea accessions in the multi-year, multi-locational trials.

