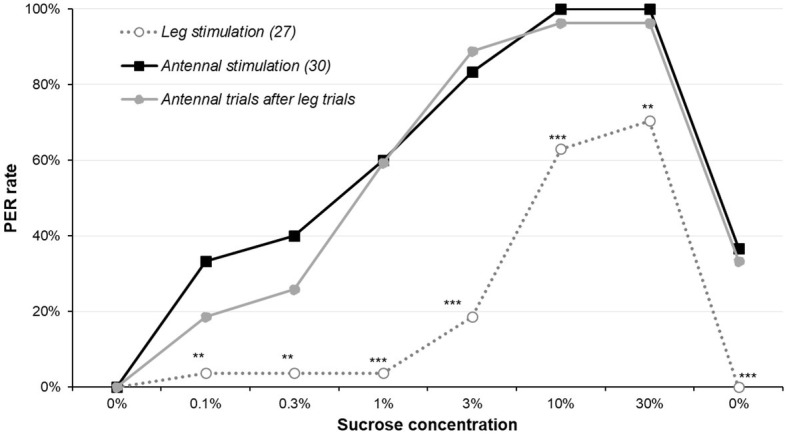
Figure 3.

Comparison of antennal stimulation and leg stimulation. The sucrose sensitivity experiment was conducted by stimulating either the antennae (as previously) or the legs of 5-day-old males starved for 5 days. Animal stimulated on the legs for the complete set of sucrose solutions underwent the protocol a second time with the antennae (i.e., the whole set of sucrose solutions was presented twice, one on the legs and the other on the antennae). Stars denote significant difference between the leg stimulated group and the antennal stimulated group run in parallel (χ2 or Fisher’s exact test; **p < 0.010; ***p < 0.001). Details of the analyses are reported in Supplementary Table S5. Other details are as in Figure 1.
