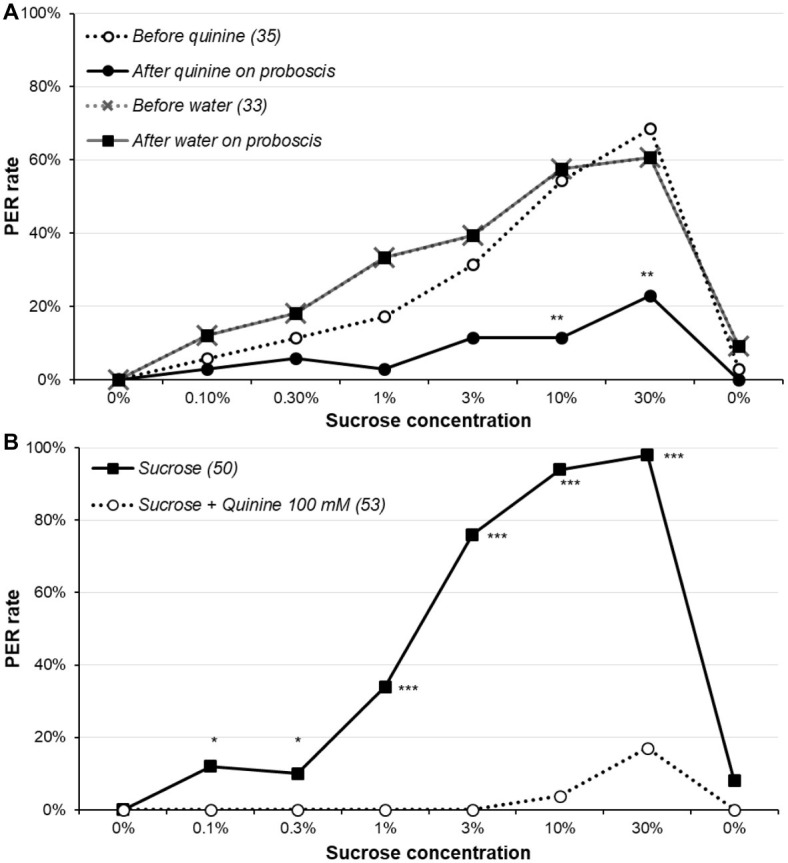
Figure 4.

Effect of quinine on sucrose responsiveness. In part (A), animals were presented the series of sucrose solutions (dotted lines), and if they released a PER, they immediately received either 100 mM quinine or water on the extended proboscis; the continuous lines indicate the proportion of animals still releasing a PER after receiving one of these solution. Notice that as touching the proboscis with water had no effect, the two lines (before and after water) are superimposed. Stars denote a significant difference between the PER rate before and after touching the proboscis with quinine, i.e., a significant rate of proboscis retraction (McNemar’s test **p < 0.010); detailed analysis is in Supplementary Table S6. In part (B), animals were presented the series of sucrose solutions either alone as previously or combined with 100 mM quinine. Stars denote a significant difference between the PER rate of the two groups (χ2; *p < 0.050, ***p < 0.001); detailed analysis is in Supplementary Table S7. All animals were 5-day-old males starved for 5 days; other details are as in Figure 1.
