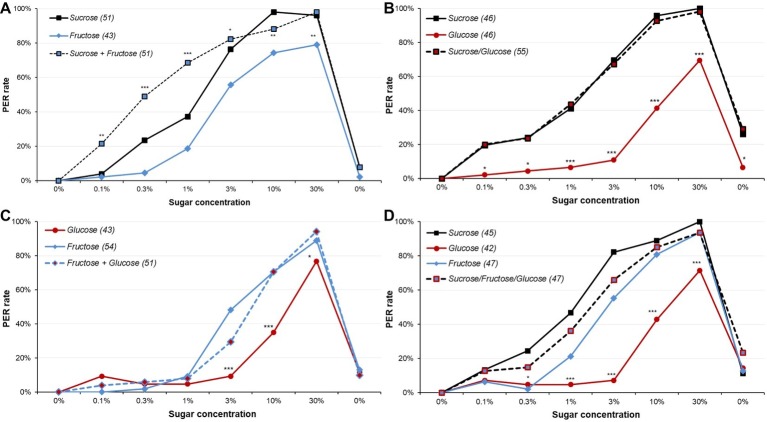
Figure 5.
Responsiveness to various sugars and sugar mixtures in male moths. These plots display dose-response curves for various sugars and sugar mixtures. Part (A) presents PER rates for fructose, sucrose, and their mixture; part (B) for glucose, sucrose, and their mixtures; part (C) for glucose, fructose, and their mixture; and part (D) for glucose, fructose, sucrose, and their mixtures. All mixtures involved even amount of sugars. All animals were 5-day-old male moths starved for 5 days. Other details as in Figure 1. Detailed analysis is reported in Supplementary Tables S8–S11.

